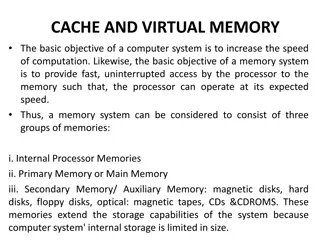
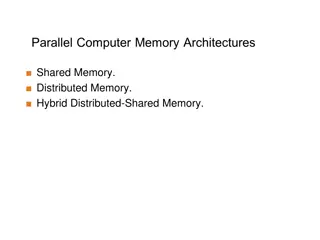
Different Mapping Schemes in Flash Memory Management

In this presentation for the DSN Group Meeting, Reza Faridmoayer discusses various mapping schemes in flash memory management, including page-level mapping, demand-based flash translation layer, block-level mapping, and hybrid-level mapping schemes. The content covers different strategies for managing NAND flash memory, advantages, disadvantages, and architectural considerations of each scheme. Detailed insights into mapping tables, logical and physical page numbers, and innovative approaches like the Demand-based Flash Translation Layer are explored, offering valuable knowledge for computer engineering professionals.

Download Presentation

Please find below an Image/Link to download the presentation.
The content on the website is provided AS IS for your information and personal use only. It may not be sold, licensed, or shared on other websites without obtaining consent from the author.If you encounter any issues during the download, it is possible that the publisher has removed the file from their server.
You are allowed to download the files provided on this website for personal or commercial use, subject to the condition that they are used lawfully. All files are the property of their respective owners.
The content on the website is provided AS IS for your information and personal use only. It may not be sold, licensed, or shared on other websites without obtaining consent from the author.
E N D
Presentation Transcript
Startup Equity Allocations, Cap Tables, Pricing Negotiations UCLA Office of Intellectual Property December 9, 2013 Stephen P. Rothman, Esq. California Massachusetts Florida www.rothmanandcompany.com steve@rothmanandcompany.com (310) 993-9664
Biographical Information 27 years business law practice Currently focus on startups from universities and their investors 20 university startup formation / financings completed in last two years Largest client is super-angel who does multiple university startup financings each year Formerly a partner at Morrison & Foerster and at Irell & Manella Now 2-person firm Experience as founder and entrepreneur Frequent speaker NCET2 webinars, Children s Hospital L.A., USC Stevens Institute, Caltech Office of Technology Transfer, Florida Innovation Hub at UF Gainesville 2 J.D., cum laude Harvard Law School, 1985 B.A., cum laude, Yale University, 1982
Terminology Pre-money valuation In the context of an upcoming equity transaction, the value that is assigned to the company prior to consummation of the financing. The earlier the stage, the less objective analysis The earlier the stage, the more a product of leverage and negotiation Accepted valuation methods for mature companies don t apply: P/E ratios Acquisition prices Revenue multiples For Internet companies with no revenue, unique visitors Asset valuation 3
Terminology 2 Pre-money valuation 2 university based startups usually too early-stage for technical, evidenced based valuation Assigned pre-money valuation is a matter of negotiation and leverage, not a real valuation. 4
Terminology 3 Post-money valuation In the context of an upcoming equity financing transaction, the value that is assigned to the company immediately following consummation of the financing. Post-money valuation = Pre-money valuation + Money Invested in Round 5
Simple Initial Capitalization Tables Example 1 Ownership (disregards preferences) Valuation Pre-money Cash in Post-money $4,000,000 $3,000,000 $7,000,000 Founder % Investor % 57.14% 42.86% Example 2 Ownership (disregards preferences) Valuation 6 Pre-money Cash in Post-money $2,000,000 $3,000,000 $5,000,000 Founder % Investor % Employee Pool University 23.00% 60.00% 15% 2%
5-Sep-09 CompanyX Consolidated Cap Table 2009 A Price $0.65 Bridge dates 5/22/2008 5/29/2008 12/15/2008 1/9/2009 Closing date 1/20/2009 Common Stock Common Options Common Warrants Series A Shares Series A Warrants Bridge Warrants 2009 A Shares As Holder Converted % Common Stock 12,811,666 $1,000,000 Current Investment $200,000 $338,750 $292,508 $4,184,596 Caltech Early employee Founder 1 Founder 2 Early employee Early employee Early employee Common Options "2008 Series A options" Employees 1 -35 XXXXXX Venture XXXXX Non-founder CEO Angel Consultant Total Pool Unissued Pool Common Warrants Attorney Law firm Series A Preferred and Preferred Warrants _____ _________ Fund LLC University Corporate VC Arm MiYZ Venture Partners _________________ Bank Angels with converts Angels without converts 221928 18000 4,000,000 4,000,000 12,308 37,500 170,000 221,928 18,000 4,200,000 4,200,000 12,308 37,500 170,000 0.83% 0.07% 15.70% 15.70% 0.05% 0.14% 0.64% Series A % 2.40% 4.39% 3.59% 52.59% 0.30% 0.105635 105635.044 0 0.2484777 248477.684 $200,000 $24,017 $43,891 $35,877 $525,914 $3,002 200,000 200,000 $42,508 $2,534,596 $0 450000 250000 0 949999.5 1936048.65 165,000 2,544,560 15,000 1,650,000 136,000 40,000 5,502,780 514,720 165,000 2,544,560 15,000 1,650,000 136,000 40,000 5,502,780 514,720 0.62% 9.51% 0.06% 6.168% 0.51% 0.150% 20.57% 1.924% $3,277,104 98.68% $986,814 $7,901,902 3,750 11,250 3,750 11,250 0.01% 0.04% 307,692 307,692 562,317 459,645 6,737,840 38,465 1522294.241 0.0536947 3183412.994 0.1189986 1.15% 2.10% 1.72% 25.19% 0.14% 521,154 384,615 2,538,462 41,163 0 0 9,632 300,000 65,397 3,899,378 7 0 38,465 769230 2593921 60756.54873 204876.6092 0 692307.6923 0 384615.3846 8,459,736 5,502,780 15,000 6,807,382 345,261 309,632 5,349,391 99.68% Totals Total issued from employee pool (inc exercised options) Series A total 26,751,682 $17,388,593 4,988,060 26.737% 7,152,643
__________ Inc. Capitalization Table As of December 31, 2013 With Debt Angel 2 $5M Before Debt Class A Common Stock 10,152,361 29.9% 10,152,361 16.5% 7,657,461 8.3% Founder 1 3,534,575 10.4% 3,534,575 5.7% 2,536,615 2.8% Founder 2 3,534,575 10.4% 3,534,575 5.7% 2,536,615 2.8% Founder 3 Pledged by Founders for Unvest Options for _____________ Emp Pledged by Founders for Key Emp Exit Sales Bonuses 1,767,287 5.2% 1,767,287 2.9% 1,268,307 1.4% 397,605 1.2% 397,605 0.6% 397,605 0.4% 918,319 2.7% 918,319 1.5% 918,319 1.0% Option Pool 3,933,333 11.6% 3,933,333 6.4% 6,428,233 7.0% 2,494,900 Series A (1) 15,000,000 44.2% 15,000,000 24.3% 15,000,000 16.3% Anti-Dilution Additional A 25,593,671 27.9% 79.66% Angel 1 Angel 2 4,591,595 5.0% Series B Notes, Fully Converted 27,713,304 45.0% 27,713,304 30.2% Series B, Warrants (Vested) 4,847,639 14.3% 4,847,639 7.9% 4,847,639 5.3% Total 33,933,333 100.0% 61,646,637 100.0% 91,831,903 100.0% Pre-money Series B 35,000,000 CP1 A = $ 0.5459 (1) 11,000,000 shares divided by 0.73333 conversion price CP1 B = $ 1.03 Full anti-dilution protection Angel 1 On=1.0 1 Angel 2 Price $ 2.5620 Angel 2 Initial Shares 1,951,625 Angel 2 converted to Common 2,661,307 4,591,595 Angel 2 Anti-dilution shares 1,930,288 Total Angel 2 Fully Diluted Shares 4,591,595 Series A Preferred Shares 11,000,000 Series A Conversion Price $ 0.73333 Series B Investment Series B Notes Accrued Int to December 31, 2013 26,400,000 $ 37,400,000 $ 2,184,333 $ Series B Conversion Price $ 1.03143 1.03143 ESOP Shares 3,933,333 Total Refinancing of Series B conv LOC Series B ESOP Target $ - 8 7.00% New $5M Bridge On=1 1 9/30/2013 1,690,583 $ 25,000.00 $ 2,500,000 10/31/2013 1,765,583 $ 51,750.00 11/30/2013 1,840,583 $ 83,750.00 12/30/2013 1,915,583 115,750.00 $ $ 2,500,000 147,750.00 $ Checks for ESOP exericse 179,750.00 $ $ 4,781.16 211,750.00 $ $ 700,000 $ 2,860.66 268,750.00 $ $ 700,000 $ 1,800.00 $ 5,000,000 $ 1,755.00 $ 11,196.82 62,205 Shares issued
Factors Influencing Pre-Money Valuation (i.e. Founder Share) Whether there is competition Overall startup investment climate Negotiation sophistication of founder or founder representative Same factors that investors consider in deciding whether to invest at all: market size; market attractiveness; Investment fads management team / previous startups stage of development; market for exits. 9
Types of Equity Interests in Corporations Common Stock residual category Straight Preferred Stock almost like debt priority over common but no upside Convertible Preferred Stock has the benefits of both common and straight preferred. Participating Convertible Preferred Stock various level of double dip 10
Convertible but not Participating Cash Invested Pre-money valuation Preferred as converted % Common as converted % $8,000,000 $8,000,000 50% 50% Sale Price Proceeds Common Convertible Preferred $0 $5,000,000 $5,000,000 Sale Price Proceeds $5,000,000 $8,000,000 Common Convertible Preferred $13,000,000 11 Investor won t like this scenario. Founder is making $5 million and I just get my money back. Go back to concept of pre-money valuation and the concept of preferences that we skipped over; did the founders really put in $8 million of value or not.
Investors response to convertible but not participating scenario Convertible and participating. Cash Invested Pre-money valuation Preferred as converted % Common as converted % $8,000,000 $8,000,000 50% 50% Sale Price Proceeds Common Convertible Preferred $0 $5,000,000 $5,000,000 Sale Price Proceeds $2,500,000 $10,500,000 Common Convertible Preferred $13,000,000 12
Founders concern with convertible and participating the double dip (was founder contribution really worth $8 million?) Partial answer capped participating convertible preferred $8 million invested, 50/50 as converted, 2X cap Sale Price Proceeds Common Convertible Preferred $0 $5,000,000 $5,000,000 Sale Price Proceeds $2,500,000 $10,500,000 Common Convertible Preferred $13,000,000 Sale Price Proceeds 13 Common Convertible Preferred >$32,000,000 50/50
LLC Capital Accounts Percentage Interest Capital Contribution $4,000,000 Investor Founder IRS Rule Distribution According to Capital Accounts Sale price Proceeds Investor $4,500,000 50% 50% $0 $5,000,000 Founder $500,000 Similar to uncapped preferred stock participation in corporate context. So founder doesn t like this. 14
Possible Alternatives in LLC Layer Cake Profit and Loss Allocations Allocated P&L per percentage interests Distributions on sale per capital accounts Investor has infinite double dip Target Profit and Loss Allocations Specify how you would like distributions to come out Allocate P&L however you need to in order to make capital accounts consistent with those distributions Satisfies IRS rule that distributions are pursuant to capital accounts, though only because the capital accounts have been tinkered with to make them equal desired distributions. 15
Median pre-money valuation of venture capital seed-stage enterprises has varied over a narrow range between $1.7 million and $2.5 million since 2002. Kauffman eVenturing The entrepreneur s trusted guide to high growth. Valuing Pre-revenue companies. p.8. www.eVenturing.org 16
Questions? Stephen P. Rothman, Esq. Rothman and Company, P.A. Sean Brady, Esq. Rothman and Company, P.A. E-MAIL: E-MAIL: steve@rothmanandcompany.com sean@rothmanandcompany.com Direct Phone: (310) 993-9664 Direct Phone: (626) 993-8424 17 www.rothmanandcompany.com


")