Digital Data in Satellite Image Analysis
Output from electronic sensors is received as numeric values represented in binary, with each bit recording a power of 2. The digital numbers, also known as brightness values or digital counts, are not true brightnesses but scaled values representing relative brightness within a scene. The number of bits per pixel determines the radiometric resolution of a digital image, impacting the range of brightness values that can be recorded. Technical specifications for remote sensing systems involve trade-offs between image coverage and resolution.

Download Presentation

Please find below an Image/Link to download the presentation.
The content on the website is provided AS IS for your information and personal use only. It may not be sold, licensed, or shared on other websites without obtaining consent from the author.If you encounter any issues during the download, it is possible that the publisher has removed the file from their server.
You are allowed to download the files provided on this website for personal or commercial use, subject to the condition that they are used lawfully. All files are the property of their respective owners.
The content on the website is provided AS IS for your information and personal use only. It may not be sold, licensed, or shared on other websites without obtaining consent from the author.
E N D
Presentation Transcript
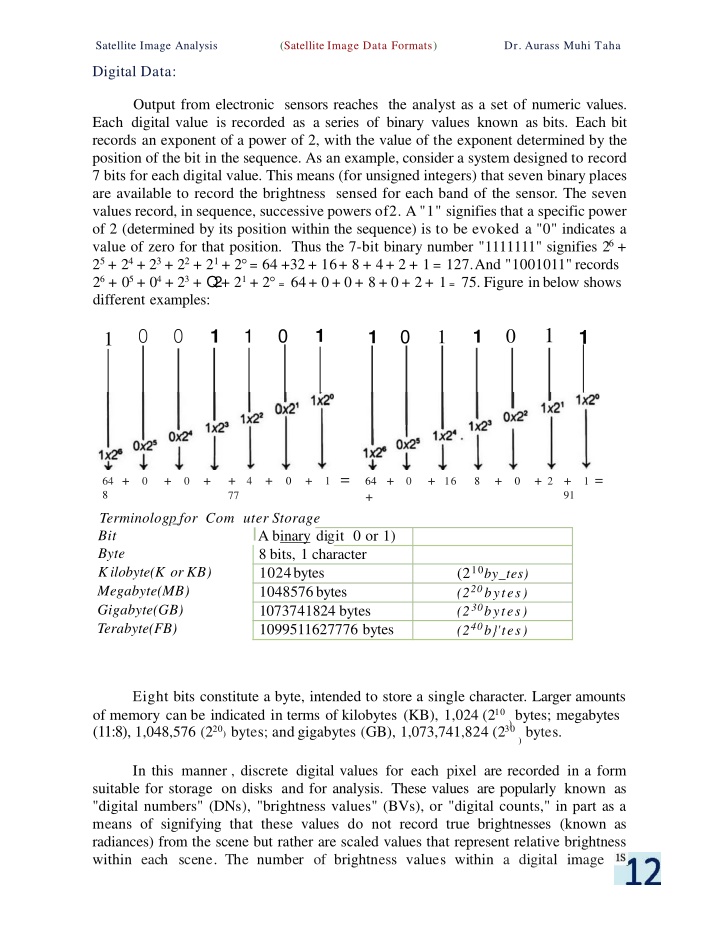
Satellite Image Analysis (Satellite Image Data Formats) Dr. Aurass Muhi Taha Digital Data: Output from electronic sensors reaches the analyst as a set of numeric values. Each digital value is recorded as a series of binary values known as bits. Each bit records an exponent of a power of 2, with the value of the exponent determined by the position of the bit in the sequence. As an example, consider a system designed to record 7 bits for each digital value. This means (for unsigned integers) that seven binary places are available to record the brightness sensed for each band of the sensor. The seven values record, in sequence, successive powers of2. A"1" signifies that a specific power of 2 (determined by its position within the sequence) is to be evoked a "0" indicates a value of zero for that position. Thus the 7-bit binary number "1111111" signifies 26+ 25+ 24+ 23+ 22+ 21+ 2 = 64 +32+ 16+ 8 + 4+ 2 + 1 = 127.And "1001011"records 26+ 05+ 04+ 23+ Q 2+ 21+ 2 = 64+ 0+ 0+ 8+ 0+ 2+ 1 = 75. Figure inbelow shows different examples: 1 0 0 0 0 1 1 1 0 1 1 1 1 1 + 4 + 0 + 1 = 77 8 + 0 + 2 + 1 = 64 + 0 + 0 + 8 64 + 0 + 16 + 91 Terminologp _for Com uter Storage Bit Byte Kilobyte(K or KB) Megabyte(MB) Gigabyte(GB) Terabyte(FB) IA binary digit 0 or 1) 8 bits, 1 character 1024bytes 1048576bytes 1073741824 bytes 1099511627776 bytes (210by_tes) (220bytes) (230bytes) (240b}'tes) Eight bits constitute a byte, intended to store a single character. Larger amounts of memory can be indicated in terms of kilobytes (KB), 1,024 (210bytes; megabytes (11:8), 1,048,576 (220) bytes; andgigabytes (GB), 1,073,741,824 (230 bytes. ) ) In this manner , discrete digital values for each pixel are recorded in a form suitable for storage on disks and for analysis. These values are popularly known as "digital numbers" (DNs), "brightness values" (BVs), or "digital counts," in part as a means of signifying that these values do not record true brightnesses (known as radiances) from the scene but rather are scaled values that represent relative brightness within each scene. The number of brightness values within a digital image
(Satellite Image Data Formats) Dr. Aurass Muhi Taha Satellite Image Analysis determined by the number of bits available. The 7-bit example given above permits a maximum range of 128possible values (0-127) for each pixel. A decrease to 6 bits would decrease the range of brightness values to 64 ( 0 an increase to 8 bits would extend the range to 256 (0-255). Thus, given a constant noise level, the number of bits minus a reserved sign bit, if used , determines the radiometric resolution of a digital image. The number of bits available is determined by the design of the system, especially the sensitivity of the sensor and its capabilities for recording and transmitting data (each added bit increases transmission requirements). 3 \ If we assume that transmission and storage resources are fixed, then increasing the number of bits for each pixel means that we will have fewer pixels per image and that pixels would each represent a larger ground area. Thus technical specifications for remote sensing systems requires trade-offs between image coverage and radiometric, spectral, and spatial resolutions. Radiances: The brightness of radiation reflected from the Earth's surface is measured as brightness (watts) per wavelength interval (micrometer) per angular unit (steradian) per square meter from which it was reflected thus the measured brightness is defined with respect to wavelength (i.e., "color"), spatial area (angle), intensity (brightness), and area. Radiances record actual brightnesses, measured in physical units, represented as real values (i.e., to include decimal fractions). Use ofDNs facilitates the design of instruments, data communications, and the visual display of image data. For visual comparison of different scenes, or analyses that examine relative brightnesses , use of DNs is satisfactory. However, because a DN from one scene does not represent the same brightness as the same DN from another scene, DNs are not comparable from scene to scene if an analysis must examine actual scene brightnesses for purposes that require use of original physical units. Such applications include comparisons of scenes of the same area acquired at different times, or matching adjacent scenes to make a mosatc. For such purposes, it is necessary to convert the DNs to the original radiances or to use reflectance, which are comparable from scene to scene and from one instrument to another. Calculation of radiances and reflectances from DNs requires knowledge of calibration data specific to each instrument. To ensure that a given sensor provides an accurate measure of brightness, it must be calibrated against targets of known brightness. The sensitivities of electronic sensors tend to drift over time, so to maintain accuracy, they must be recalibrated on a systematic schedule. Although those sensors used inaircraft canbe recalibrated periodically, those used in satellitesarenot available after launch for the same kind of recalibration. Typically, such sensors are designed so 13
(Satellite Image Data Formats) Satellite Image Analysis Dr. Aurass Muhi Taha that they can observe calibration targets onboard the satellite, or they are calibrated by viewing landscapes of uniform brightness (e.g., the moon or desert regions). Digital image Data Formats: Digital image analysis is usually conducted using raster data structures in which each image is treated as an array of values. Additional spectral channels form additional arrays that register to one another. Each pixel is treated as a separate unit, which can always be located within the image by its row and column coordinates. In most remote sensing analysis, coordinates originate in the upper left-hand corner of an image and are referred to as rows and columns, or as lines and pixels, to measure position down and to the right, respectively. Raster data structures offer advantages for manipulation of pixel values by image processing systems, as it is easy to find and locate pixels and their values. The disadvantages are usually apparent only when we need to represent not the individual pixels, but areas of pixels, as discrete patches or regions. Then the alternative structure, vector format, becomes more attractive. The vector format uses polygonal patches and their boundaries as the fundamental units for analysis and manipulation. The vector format is not appropriate for digital analysis of remotely sensed data, although sometimes we may wish to display the results of our analysis using a vector format. Almost always, equipment and software for digital processing of remotely sensed data must be tailored for a raster format. Digital remote sensing data are typically organized according to one of three alternative strategies for storing images. Consider an image consisting of four spectral channels, which together can be visualized as four superimposed images, with corresponding pixels in one band registering exactly to those in the other bands. One of the earliest formats for digital data was: 1) Band Interleaved by Pixel (BIP): Data are organized in sequence values for line 1, pixel 1, band 1 then for line 1,pixel 1, band 2 then for line 1, pixel 1, band 3 and finally for line 1, pixel 1, band 4. Next are the four bands for line 1,pixel 2, and so on the table at below: 1,1,1 1,1,2 1,2,1 1,2,2 1,3,1 1,3,2 1,4,1 1,4,2 1,5,1 1,5,2 2,1,1 2,1,2 2,2,1 2,2,2 2,3,1 2,3,2 2,4,1 2,4,2 2,5,1 2,5,2 Thus values for all four bands are written before values for the next pixel are represented. Any given pixel, once located within the data, is found with values for all four bands written in sequence one directly after the other. This arrangement is advantageous for many analyses in which the brightness value (or digital number) 14
(Satellite Image Data Formats) Satellite Image Analysis Dr. Aurass Muhi Taha vector is queried or used to calculate another quantity. However, it is an unwieldy format for image display. 2) The Band Interleaved by Line (BIL): Format treats each line of data as a separate unit. In sequence, the analyst encounters line 1 for band 1, line 1 for band 2, line 1 for band 3, line 1 for band 4, line 2 for band 1, line 2 for band 2, and so on. Each line is represented in all four bands before the next line is encountered. A common variation on the BIL format is to group lines in setsof3 or 7, for example, rather than to consider each single line asthe unit. 1,1,1 1,2,1 1,3,1 1,4,1 1,5,1 1,6,1 1,7,1 1,1,2 1,2,2 1,3,2 1,4,2 1,5,2 1,6,2 1,7,2 1,1,3 1,2,3 1,3,3 1,4,3 1,5,3 1,6,3 1,7,3 2,1,1 2,2,1 2,3,1 2,4,1 2,5,1 2,6,1 2,7,1 2,1,2 2,2,2 2,3,2 2,4,2 2,5,2 2,6,2 2,7,2 2,1,3 2,2,3 2,3,3 2,4,3 2,5,3 2,6,3 2,7,3 3) The Band Sequential (BSQ): All data for band 1 are written in sequence, followed by all data for band 2, and so on. Each band is treated as a separate unit. For many applications, this format is the most practical, as it presents data in the format that most closely resembles the data structure used for display and analysis. However , if areas smaller than the entire scene are to be examined , the analyst must read all four images before the subarea can be identified and extracted. Actual data formats used to distribute digital remote sensing data are usually variations on these basic alternatives. Exact details of data formats are specific to particular organizations and to particular forms of data, so whenever an analyst acquires data, he or she must make sure to acquire detailed information regarding the data format. Although organizations attempt to standardize formats for specific kinds of data, it is also true that data formats change as new mass storage media come into widespread use and as user communities employ new kinds of hardware or software. The "best" data format depends on immediate context and often on the specific software and equipment available. If all bands for an entire image must be used, then the BSQ and BIL formats are useful because they are convenient for reconstructing the entire scene in all four bands. If the analyst knows beforehand the exact position on the image of the subarea that is to be studied, then the BIP format is useful because values for all bands are found together and it is not necessary to read through the entire data set to find a specific region. In general, however, the analyst must be prepared to read the data inthe format inwhichthey arereceived andto convert them into the format most convenient for use at a specific laboratory. 15

")
")
")