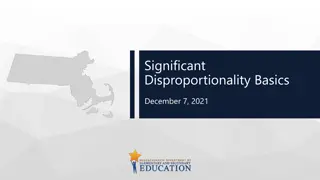
Disproportionality and Disparity in California Child Welfare Systems Data Analysis
Explore the data on disproportionality and disparity in the California child welfare system, highlighting ethnic breakdowns, entries to foster care, racial disparity indices, and population in poverty estimates for 2024.

Download Presentation

Please find below an Image/Link to download the presentation.
The content on the website is provided AS IS for your information and personal use only. It may not be sold, licensed, or shared on other websites without obtaining consent from the author. If you encounter any issues during the download, it is possible that the publisher has removed the file from their server.
You are allowed to download the files provided on this website for personal or commercial use, subject to the condition that they are used lawfully. All files are the property of their respective owners.
The content on the website is provided AS IS for your information and personal use only. It may not be sold, licensed, or shared on other websites without obtaining consent from the author.
E N D
Presentation Transcript
Disproportionality and Disparity in California Child Welfare Systems What the Data Tell Us CA Child Welfare Indicators Project School of Social Welfare University of California, Berkeley 1
Disproportionality vs. Disparity Disproportionality: When a group makes up a proportion of those experiencing some event that is higher or lower than that group s proportion of the population Disparity: A comparison of one group (e.g., regarding disproportionality, services, outcomes) to another group 2
Ethnicity and Path Through the Child Welfare System California: 2024 (missing & multi-race values excluded from % calculations) 0.4 1.2 1.3 0.8 0.9 1.1 100% 1.9 2.6 3.5 4.8 5.1 14.3 90% 80% Native American 70% 56.3 55.9 56.0 59.0 57.3 Asian/PI 60% 52.7 50% Latino 40% White 20.3 30% 22.0 24.3 22.8 22.0 20% 27.2 Black 10% 20.3 18.3 14.4 14.3 13.8 5.4 0% Population (8,544,834) Allegations (417,513) Investigations (269,780) Substantiations (46,457) Entries (17,390) In Care (34,261) 3
Entries to Foster Care Compared to General Population California: 2024 (missing & multi-race values excluded from % calculations) 0.4 1.2 100% Black Disproportionality 2.6 14.3 18.3 5.4 90% = 3.39 Native American 80% 70% Asian/PI White Disproportionality 55.9 22.0 27.2= 0.81 60% 52.7 Latino 50% 40% White Black/White Disparity Index ?.?? ?.??= ~4.18 30% 22.0 Black 20% 27.2 Black children are 4.18 times as likely to enter care as White children. 10% 18.3 5.4 0% Population (8,544,834) Entries (17,390) 4
General Population Racial Disparity Indices California: 2024 (group compared to White) 2.86 3.15 Black 3.31 4.18 5.04 2.5 2.61 Native American 3.5 3.94 4.63 1.19 1.29 allegations Latino 1.38 1.31 investigations 1.43 substantiations entries 0.4 0.4 in care Asian/PI 0.3 0.22 0.18 5
Population in Poverty Estimates Combination of data from the U.S. Census Bureau's American Community Survey (ACS), and population data from The California Department of Finance. Separate multipliers were created for each Race/Ethnicity at the state level and for each of the 58 counties. Poverty Multiplier = ?????? ?? ? ?????? ?? ??????? ????? ?????? ?? ? ?????? The multiplier was then applied to the California Department of Finance Population Estimates 6
Population in Poverty Racial Disparity Indices California: 2024 (group compared to White) 0.87 0.96 Black 1.01 1.28 1.54 0.96 1 Native American 1.34 1.51 1.78 0.47 0.51 allegations Latino 0.55 0.52 investigations 0.57 substantiations entries 0.32 0.32 in care Asian/PI 0.25 0.18 0.15 7
Thank You! The California Child Welfare Indicators Project (CCWIP) is a collaboration of the California Department of Social Services and the School of Social Welfare, University of California at Berkeley, and is supported by the California Department of Social Services, Casey Family Programs, and the Conrad N. Hilton Foundation. 8
Questions? Wendy Wiegmann wendy.wiegmann@berkeley.edu 9