Distance-Time Graphs for Understanding Travel Progress
Explore distance-time graphs to understand travel progress, calculate average speed, and analyze train journeys between cities. Learn how to determine distances traveled, speeds at different intervals, and overall average speed.
Download Presentation

Please find below an Image/Link to download the presentation.
The content on the website is provided AS IS for your information and personal use only. It may not be sold, licensed, or shared on other websites without obtaining consent from the author. If you encounter any issues during the download, it is possible that the publisher has removed the file from their server.
You are allowed to download the files provided on this website for personal or commercial use, subject to the condition that they are used lawfully. All files are the property of their respective owners.
The content on the website is provided AS IS for your information and personal use only. It may not be sold, licensed, or shared on other websites without obtaining consent from the author.
E N D
Presentation Transcript
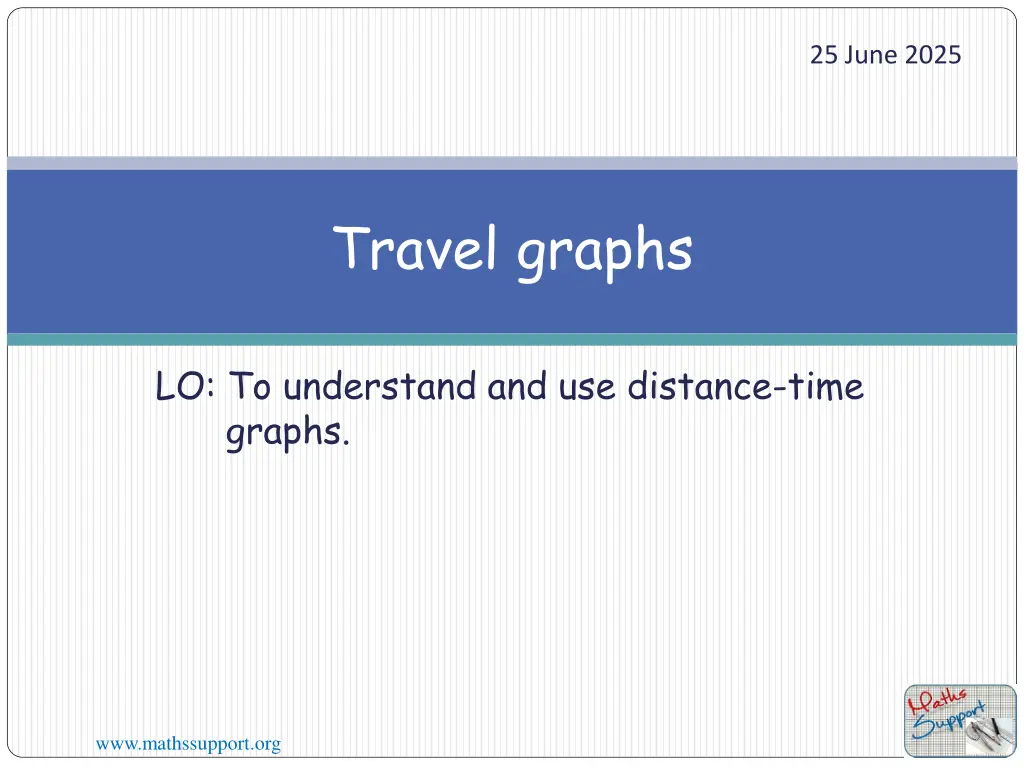
25 June 2025 Travel graphs LO: To understand and use distance-time graphs. www.mathssupport.org
Distance-time graphs In a distance-time graph the horizontal axis shows time and the vertical axis shows distance. Suppose a car travels 150 kilometres in 2 hours distance time Average speed = 150 distance (km) 150 2 120 Average speed = steady speed 90 Average speed = 75 km/h A 60 Notice that the point A on the graph indicates we have traveled 75 km in one hour. 30 0 0 0.5 1 1.5 2 2.5 3 3.5 4 time (hours) www.mathssupport.org
Distance-time graphs The graphs shows the progress of a train travelling between cities. (a) How far does the train travel in the first 3 hours? 200 km 66.7 km/h (b) Find the speed of the train for the first 3 hours? (c) Find the speed of the train during the final hour of the journey (d) Find the average speed of the train for the entire journey 200 km (a) From the graph 250 distance (km) (b) Using the formula 200 Speed = distance 150 time 200 3 100 Speed = 50 0 Speed 66.7 km/h 0 0.5 1 1.5 2 2.5 3 3.5 4 time (hours) www.mathssupport.org
Distance-time graphs The graphs shows the progress of a train travelling between cities. (a) How far does the train travel in the first 3 hours? 200 km 66.7 km/h (b) Find the speed of the train for the first 3 hours? (c) Find the speed of the train during the final hour of the journey (d) Find the average speed of the train for the entire journey 250 (c) Using the formula distance (km) 200 Speed = distance time 25 1 150 100 Speed = 50 Speed 25 km/h 0 0 0.5 1 1.5 2 2.5 3 3.5 4 time (hours) www.mathssupport.org
Distance-time graphs The graphs shows the progress of a train travelling between cities. (a) How far does the train travel in the first 3 hours? 200 km 66.7 km/h (b) Find the speed of the train for the first 3 hours? (c) Find the speed of the train during the final hour of the journey (d) Find the average speed of the train for the entire journey 250 (d) Using the formula distance (km) 200 Speed = distance time 225 4 150 A 100 Speed = 50 Speed 56.25 km/h 0 0 0.5 1 1.5 2 2.5 3 3.5 4 time (hours) www.mathssupport.org
Distance-time graphs In a distance-time graph the horizontal axis shows time and the vertical axis shows distance. For example, this distance-time graph shows a journey. What does the slope of the line tell us? distance The slope of the line tells us the average speed. The steeper the line is, the faster the speed. 0 time www.mathssupport.org
Distance-time graphs In a distance-time graph the horizontal axis shows time and the vertical axis shows distance. For example, John takes his car to visit a friend. There are three parts to the journey: John drives at constant speed (uniform speed) for 30 minutes until he reaches his friend s house 20 km away. stationary distance (km) 20 steady speed 15 Returning to start He stays at his friend s house for 45 minutes. 10 5 He then drives home at a constant speed and arrives home 45 minutes later. 0 0 15 30 45 60 75 90 105 120 time (mins) www.mathssupport.org
Distance-time graphs The graph illustrate how Jamil moves as he goes to the paper shop 150 seconds 450 m 3 m/s How long does it takes Jamil to cycle to the shop? What distance does Jamil cycle to get to the shop? Calculate the speed at which Jamil cycles to the shop How long does Jamil spends at the shop? Calculate the speed at which Jamil cycles on his way home 90s 3.75 m/s www.mathssupport.org
Distance-time graphs Andrew was traveling in his car to a meeting. He set off from home at 8.00 a.m (e) 11 am and 12:30 pm 5 pm At what time did he get to his meeting place? When did he travel the slowest? At what times did he stop for breaks? At what average speed was he traveling in (a), (b), (c), and (e)? (a) 100km/h, (b) 0 km/h, (c) 100km/h, (e)37.5km/h www.mathssupport.org
Thank you for using resources from A close up of a cage Description automatically generated For more resources visit our website https://www.mathssupport.org If you have a special request, drop us an email info@mathssupport.org www.mathssupport.org


