Diversity Analysis of Medical Corps in Active Duty - Racial and Gender Breakdown
Explore the demographic breakdown of the Medical Corps in Active Duty, focusing on racial and gender diversity across different ethnic groups. The analysis includes data on American Indian, Alaskan Native, Asian, Black or African American, Native Hawaiian or Other Pacific Islander, White, Multiple Races, Hispanic or Latino, and Not Hispanic or Latino populations. Discover the distribution of medical officers among various racial and ethnic backgrounds in the context of the Military Medical Corps.

Download Presentation

Please find below an Image/Link to download the presentation.
The content on the website is provided AS IS for your information and personal use only. It may not be sold, licensed, or shared on other websites without obtaining consent from the author. If you encounter any issues during the download, it is possible that the publisher has removed the file from their server.
You are allowed to download the files provided on this website for personal or commercial use, subject to the condition that they are used lawfully. All files are the property of their respective owners.
The content on the website is provided AS IS for your information and personal use only. It may not be sold, licensed, or shared on other websites without obtaining consent from the author.
E N D
Presentation Transcript
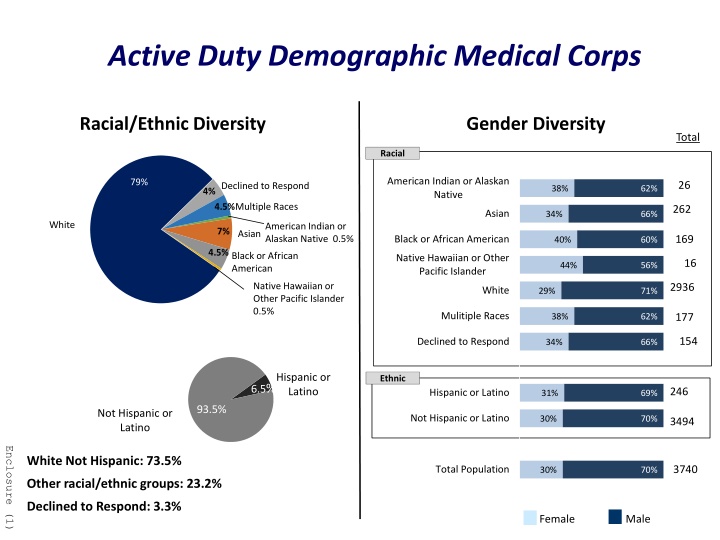
Active Duty Demographic Medical Corps Racial/Ethnic Diversity Gender Diversity Total Racial American Indian or Alaskan Native 79% 26 Declined to Respond 38% 62% 4% Multiple Races 4.5% 262 Asian 34% 66% White American Indian or Alaskan Native 0.5% 7% Asian 169 Black or African American 40% 60% 4.5% Black or African American Native Hawaiian or Other Pacific Islander 16 44% 56% Native Hawaiian or Other Pacific Islander 0.5% 2936 White 29% 71% Mulitiple Races 177 38% 62% 154 Declined to Respond 34% 66% Hispanic or Latino Ethnic 6.5% 246 Hispanic or Latino 31% 69% 93.5% Not Hispanic or Latino Not Hispanic or Latino 30% 70% 3494 Enclosure (1) White Not Hispanic: 73.5% 3740 Total Population 30% 70% Other racial/ethnic groups: 23.2% Declined to Respond: 3.3% Female Male
Active Duty Demographic Dental Corps Racial/Ethnic Diversity Gender Diversity Total Racial Declined to Respond American Indian or Alaskan Native 2.5% 9 22% 78% 69% 7% Multiple Races 180 Asian 35% 65% White American Indian or Alaskan Native 0.5% 15.5% 57 Black or African American 40% 60% Asian Native Hawaiian or Other Pacific Islander 6 50% 50% 5% Black or African American 805 White 26% 74% Native Hawaiian or Other Pacific Islander 0.5% Mulitiple Races 84 36% 64% 28 Declined to Respond 25% 75% Hispanic or Latino Ethnic 9% 106 Hispanic or Latino 35% 65% 91% Not Hispanic or Latino Not Hispanic or Latino 28% 72% 1063 Enclosure (2) White Not Hispanic: 62.5% 1169 Total Population 29% 71% Other racial/ethnic groups: 36.0% Declined to Respond: 1.5% Female Male
Active Duty Demographic Medical Service Corps Racial/Ethnic Diversity Gender Diversity Total Racial Declined to Respond 3.5% American Indian or Alaskan Native 42 32% 68% Multiple Races 6.5% American Indian or Alaskan Native 1.5% 234 Asian 67% 32% 68% White 9% Asian 331 Black or African American 39% 61% Native Hawaiian or Other Pacific Islander 12% 15 40% 60% Black or African American 1827 White 34% 66% Native Hawaiian or Other Pacific Islander 0.5% Mulitiple Races 179 42% 58% 92 Declined to Respond 41% 59% Ethnic Hispanic or Latino 280 Hispanic or Latino 10% 37% 63% 90% Not Hispanic or Latino Not Hispanic or Latino 35% 65% 2440 Enclosure (3) White Not Hispanic: 60.4% 2720 Total Population 35% 65% Other racial/ethnic groups: 37.8% Declined to Respond: 1.8% Female Male
Active Duty Demographic Nurse Corps Racial/Ethnic Diversity Gender Diversity Total Racial American Indian or Alaskan Native 40 Declined to Respond 6.5% 58% 42% Multiple Races 5% 214 American Indian or Alaskan Native 1.5% Asian 59% 41% White 66% 7.5% Asian 335 Black or African American 70% 30% 12% Native Hawaiian or Other Pacific Islander Black or African American 43 60% 40% 1856 White 64% 36% Native Hawaiian or Other Pacific Islander 1.5% Mulitiple Races 141 60% 40% 178 Declined to Respond 67% 33% Ethnic Hispanic or Latino 289 Hispanic or Latino 10% 58% 42% 90% Not Hispanic or Latino Not Hispanic or Latino 65% 35% 2518 Enclosure (4) White Not Hispanic: 59.6% 2807 Total Population 64% 36% Other racial/ethnic groups: 35.8% Declined to Respond: 4.6% Female Male
Active Duty Demographic Total Medical Officers Racial/Ethnic Diversity Gender Diversity Total Racial Declined to Respond American Indian or Alaskan Native 117 42% 58% 4.5% Multiple Races American Indian or Alaskan Native 1% 890 5.5% Asian 40% 60% White 71% 892 Black or African American 8.5% 51% 49% Asian Native Hawaiian or Other Pacific Islander 80 53% 47% 8.5% Black or African American 7424 White 38% 62% Native Hawaiian or Other Pacific Islander 1% Mulitiple Races 581 44% 56% 452 Declined to Respond 48% 52% Ethnic Hispanic or Latino 921 Hispanic or Latino 9% 42% 58% 91% Not Hispanic or Latino Not Hispanic or Latino 40% 60% 9515 Enclosure (5) White Not Hispanic: 65.1% 10436 Total Population 40% 59% Other racial/ethnic groups: 31.8% Declined to Respond: 3.1% Female Male