Diversity and Progress in Math Science Graduate Programs: A Statistical Overview
Key statistics and trends regarding underrepresented minority graduate students in math science programs, Alliance students earning Ph.D.s, F-GAP program outcomes, and post-Ph.D. career paths. Detailed visual representations depict the number of students, program admissions, completion rates, and industry placements.

Uploaded on Dec 13, 2024 | 1 Views
Download Presentation

Please find below an Image/Link to download the presentation.
The content on the website is provided AS IS for your information and personal use only. It may not be sold, licensed, or shared on other websites without obtaining consent from the author.If you encounter any issues during the download, it is possible that the publisher has removed the file from their server.
You are allowed to download the files provided on this website for personal or commercial use, subject to the condition that they are used lawfully. All files are the property of their respective owners.
The content on the website is provided AS IS for your information and personal use only. It may not be sold, licensed, or shared on other websites without obtaining consent from the author.
E N D
Presentation Transcript
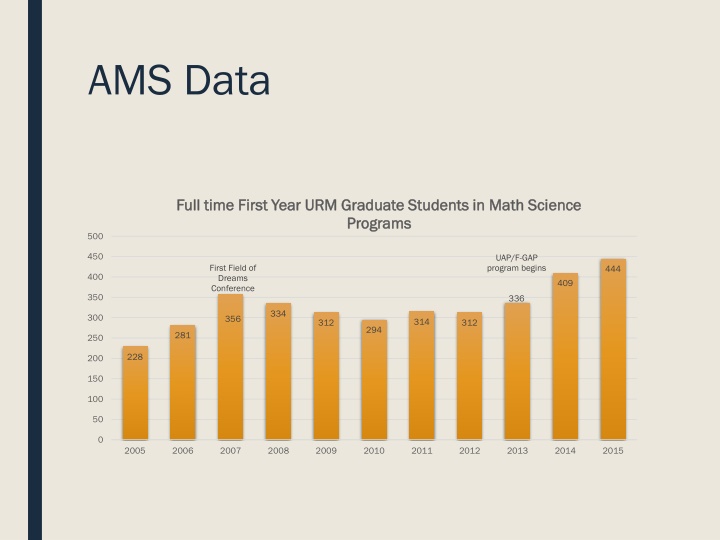
AMS Data Full time First Year URM Graduate Students in Math Science Full time First Year URM Graduate Students in Math Science Programs Programs 500 450 UAP/F-GAP program begins First Field of Dreams Conference 444 400 409 350 336 334 300 356 314 312 312 294 281 250 228 200 150 100 50 0 2005 2006 2007 2008 2009 2010 2011 2012 2013 2014 2015
Number of Alliance students presently in a math sciences grad program by year of earned BS. (blue=total, yellow=minority) 80 70 60 50 40 30 20 10 0 Pre 2010 2010 2011 2012 2013 2014 2015
As of Spring, 2015 Number of Alliance Students who were full-time graduate students in a math science graduate program: 245 Number of these students who come from underrepresented minority groups: 190 (78%)
F-GAP Data F-GAP results 120 100 80 60 40 20 0 2013 2014 2015 2016 Participants Admitted to Grad Program F-GAP students entered Grad Programs Number responded to tracking survey Number continuing in their program
Alliance math sciences Ph.Ds completed by year of earned BS Completed PhD 40 35 30 25 20 15 10 5 0 Pre 2010 2010 2011 2012 2013 2014 2015
Completed PhD Completed PhD- - Where are they now? Where are they now? 9% 9% 14% 14% Academic Other Research 7% 7% Industry Government 70% 70%


