Explore a study on genome-wide DNA methylation differences in the nucleus accumbens of smokers compared to nonsmokers, revealing unique DNAm changes in the brain linked to smoking behavior. The research sheds light on molecular alterations in response to nicotine exposure and its implications for diseases like lung cancer and schizophrenia.
Please find below an Image/Link to download the presentation.
The content on the website is provided AS IS for your information and personal use only. It may not be sold, licensed, or shared on other websites without obtaining consent from the author. If you encounter any issues during the download, it is possible that the publisher has removed the file from their server.
You are allowed to download the files provided on this website for personal or commercial use, subject to the condition that they are used lawfully. All files are the property of their respective owners.
The content on the website is provided AS IS for your information and personal use only. It may not be sold, licensed, or shared on other websites without obtaining consent from the author.
E N D
Presentation Transcript
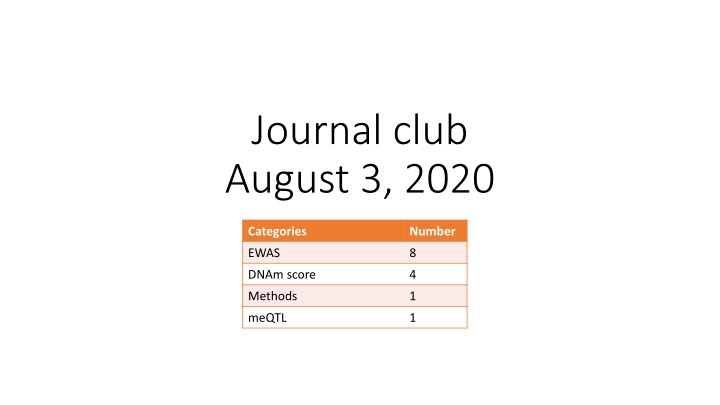
Journal club August 3, 2020 Categories Number EWAS 8 DNAm score 4 Methods 1 meQTL 1
Smoking changes DNAm in the brain but not like blood or saliva or fat or lung Markunas CA, Semick SA, Quach BC, et al. Genome-wide DNA methylation differences in nucleus accumbens of smokers vs. nonsmokers. Neuropsychopharmacology. 2020;10.1038/s41386-020-0782-0. n=120 European American; n=101 African American (~25% smokers) nicotine smoking gwas smoking exp prenatal smoke lung cancer schizophrenia dopamine
EWAS Phenotype Tissue N CpGs Note PMID Journal 2325 Int J Obes (Lond) Aging Alzheimers Dement (Amst). Int J Hyg Environ Health BMI, WC, %BF Blood 8264 %BF and WC biologically distinct 32728124 (mostly age 50-64) 12300 (CHARGE) Death Blood 9 MR association of 2 with CHD 32697766 73 cases vs 87 controls Dementia Blood 1 Blood samples taken prior to diagnosis 32671182 Pyrethroid pesticide Polychlorinated biphenyls (PCBs) Maternal plasma persistent organic pollutants (POP) Dyslipidemia Blood 237 4 32679516 Blood 641 1345 (!) R=0.29 with CRP EWAS effects 32660331 Epigenetics 44 of these also associated with birth length, birthweight or head circumference (in this study) 214 with 10 POPs Clin Placenta 260 32653021 Epigenetics Placenta 262 11 *only access to a confusing abstract* 32677467 Epigenomics
DNAm CRP is much more than CRP Stevenson AJ, McCartney DL, Hillary RF, et al. Characterisation of an inflammation- related epigenetic score and its association with cognitive ability. Clin Epigenetics. 2020;12(1):113. Data: Lothian Birth Cohort (n=889), Generation Scotland (n=7028) R~0.3 between serum CRP and DNAm CRP score Serum CRP DNAm CRP score Genetic CRP R>0.2 Null Age Decrease (p=0.003) Increase (p < 2e-16) BMI/ Smoking Pos/Pos Pos/Pos Alcohol/Social deprivation Null Pos/Neg Reliability (test-re-test) ICC=0.72 ICC=0.82 Cognitive ability None (p > 0.25) Negative (p = 0.04)
Colorectal cancer predictor puts reviewers to sleep Onwuka JU, Li D, Liu Y, et al. A panel of DNA methylation signature from peripheral blood may predict colorectal cancer susceptibility. BMC Cancer. 2020;20(1):692. n=166 cases vs n=424 controls (GEO) Methods 1. EWAS identified 48 differentially methylated CpG sites 2. Dataset split into 70% training/30% testing partitions 3. LASSO identifies 22-CpG site model from 48 4. Stepwise logistic regression identifies 19-CpG site model from 48 5. Final model generated by fitting logistic regression model to 16 sites in common In 30% testing partition: AUC = 0.82 In TCGA data: AUC = 0.73 (appears that model coefficients were recalculated)
Circulating tumor DNA methylation can be detected Chen X, Gole J, Gore A, et al. Non-invasive early detection of cancer four years before conventional diagnosis using a blood test. Nat Commun. 2020;11(1):3475. Small amounts of tumor DNA ends up in blood ( circulating tumor DNA = ctDNA ) Strategy (PanSeer): - Identify hundreds DNAm differences between tumor and normal tissue (11,787 CpG sites across 595 regions) - Use a sensitive method to measure DNA methylation at these loci in ctDNA (semi- targeted PCR) - Train a predictive model using ensemble logistic regression Test: apply model to participants who provided samples prior to being diagnosed with stomach, esophageal, colorectal, lung or liver cancer <= 4 years later Results: Sensitivity > 94%, Specificity > 95%
GrimAge and DunedinPoAm are complementary Hillary RF, Stevenson AJ, McCartney DL, et al. Epigenetic measures of ageing predict the prevalence and incidence of leading causes of death and disease burden. Clin Epigenetics. 2020;12(1):115. Data: Generation Scotland split into discovery (n=4450) and replication (n=2578). Methods: 1. DNAm measures: GrimAge, PhenoAge, Telomere Length, DunedinPoAm, HannumAge, DNAmAge 2. Phenotypes: 33 including all cause mortality, 14 disease, 18 continuous 3. Association tests (33 x 6) in the discovery set a. Basic model: Phenotype ~ Epigenetic Measure + age + sex b. Fully adjusted model: Phenotype ~ Epigenetic Measure + age + sex + alcohol units consumed per week + body mass index + educational attainment + Scottish Index of Multiple Deprivation + smoking pack years 4. Any the survive adjustment for multiple tests are evaluated in the replication set
Forget about meQTLs, here DNAm modifies SNP effects Romanowska J, Haaland A, Jugessur A, et al. Gene-methylation interactions: discovering region-wise DNA methylation levels that modify SNP-associated disease risk. Clin Epigenetics. 2020;12(1):109. Input: case-parent dyad/triad genotypes, DNAm profiles for cases Method: Search for interactions 1. G x Me: methylation modifies SNP effect 2. PoO x Me: methylation modifies parent-of-origin SNP effect (parent-of-origin effect: SNP effect depends on parent it came from) Power is a huge issue summarize methylation over regions (average DNAm) Apply in cleft study as proof of principle, identify a couple of examples
Genotype loses to environment in old age Reynolds CA, Tan Q, Munoz E, et al. A decade of epigenetic change in aging twins: Genetic and environmental contributions to longitudinal DNA methylation. Aging Cell. 2020;e13197. Data: 96 pairs of elderly twins, blood DNAm measured 2 times, 10 years apart Methods: Fit bivariate ACE and ADE Cholesky models to evaluate the degree to which additive genetic (A), dominance or non additive genetic (D), common environmental (C), and non shared factors (E) contribution DNAm variation Results: 1. Genotype explains 23.8% of DNAm variation at time 1, and 18% at time 2 2. Age-associated CpG sites (previous studies) were more heritable than others 3. 5K most heritable sites enriched in immune and inflammation pathways 4. 2K least stable sites were enriched in stress-related pathways