Download and Visualize Persues Data: A Step-by-Step Guide
Learn how to create data files, run Perseus in a terminal window, plot persistence diagrams, and understand the output for analyzing complex datasets using Perseus software. Follow this comprehensive guide for utilizing Perseus effectively.

Download Presentation

Please find below an Image/Link to download the presentation.
The content on the website is provided AS IS for your information and personal use only. It may not be sold, licensed, or shared on other websites without obtaining consent from the author. If you encounter any issues during the download, it is possible that the publisher has removed the file from their server.
You are allowed to download the files provided on this website for personal or commercial use, subject to the condition that they are used lawfully. All files are the property of their respective owners.
The content on the website is provided AS IS for your information and personal use only. It may not be sold, licensed, or shared on other websites without obtaining consent from the author.
E N D
Presentation Transcript
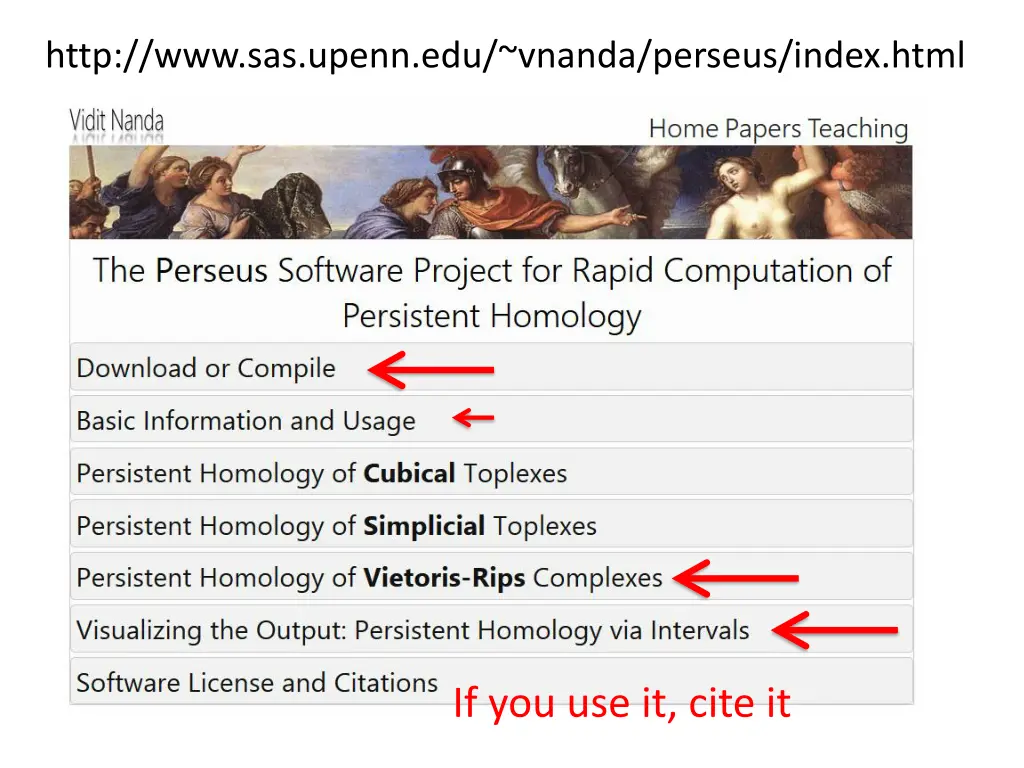
http://www.sas.upenn.edu/~vnanda/perseus/index.html If you use it, cite it
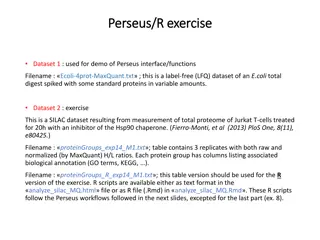
Create your data file. Note first 2 rows contain the information described below Number of coordinates (i.e., number of columns in your original data set). 3 1 0.01 50 1.2 3.4 -0.9 0.1 2.0 -6.6 4.1 0.1 Your data points plus extra column = starting radius r Scaling factor k = 1, step size s = 0.1, number of steps N = 5, At time step i, radius of ball = kr + si, for i = 0, , N
Note: Instead of entering data points, you can use a distance matrix Number of data points. I.e., size of matrix is 3x3 3 0 0.1 5 2 0 0.26 0.4 0.26 0 2.1 0.4 2.1 0 distance matrix (symmetric) initial radius r = 0, step size s = 0.1, number of steps N = 5, dimension cap C = 2 Increase radius by 0.1 five times. max dim of simplices
To change directory into Downloads: cd Downloads To make perseusLin executable: chmod 700 perseusLin. To run your file: ./perseusLin brips input.txt output This will create several files (overwriting existing files): output_0.txt, output_1.txt,... and so on. How many such files are created depends on how many dimensions the discrete Morse-reduced complex actually has. Some files will be empty. output_i.txt contains birth death times for ith homology. output_betti.txt contains the Betti numbers at each step in the filtration. See Visualizing the Output: Persistent Homology via Intervals for more info
Plotting Persistence Diagrams In order to aid with visualization, a simple Matlab script called persdia has been bundled along with the source code for Perseus. This script may be called from the Matlab command prompt to plot the Perseus output file as a persistence diagram in the following way: Make sure you set the directory to the one containing your Perseus files.