DPPH Radical Scavenging Activity Chart
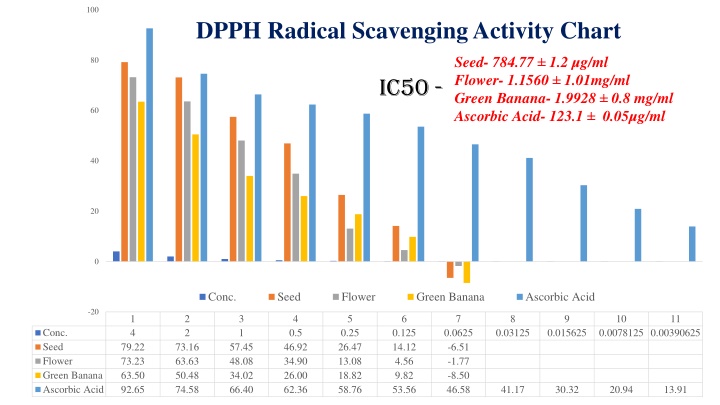
The charts present the DPPH, ABTS radical scavenging activities, reduction potential, and NO radical scavenging activity of seeds, flowers, green bananas, and ascorbic acid. These data provide insights into the antioxidant capabilities of different sources and their potential benefits in health and nutrition.

Download Presentation

Please find below an Image/Link to download the presentation.
The content on the website is provided AS IS for your information and personal use only. It may not be sold, licensed, or shared on other websites without obtaining consent from the author.If you encounter any issues during the download, it is possible that the publisher has removed the file from their server.
You are allowed to download the files provided on this website for personal or commercial use, subject to the condition that they are used lawfully. All files are the property of their respective owners.
The content on the website is provided AS IS for your information and personal use only. It may not be sold, licensed, or shared on other websites without obtaining consent from the author.
E N D
Presentation Transcript
100 DPPH Radical Scavenging Activity Chart Seed- 784.77 1.2 g/ml Flower- 1.1560 1.01mg/ml Green Banana- 1.9928 0.8 mg/ml Ascorbic Acid- 123.1 0.05 g/ml 80 IC50 - 60 40 20 0 Conc. Seed Flower Green Banana Ascorbic Acid -20 1 4 2 2 3 1 4 5 6 7 8 9 10 11 Conc. Seed Flower Green Banana Ascorbic Acid 0.5 46.92 34.90 26.00 62.36 0.25 26.47 13.08 18.82 58.76 0.125 14.12 4.56 9.82 53.56 0.0625 -6.51 -1.77 -8.50 46.58 0.03125 0.015625 0.0078125 0.00390625 79.22 73.23 63.50 92.65 73.16 63.63 50.48 74.58 57.45 48.08 34.02 66.40 41.17 30.32 20.94 13.91
ABTS Radical Scavenging Activity Chart 100 IC50- Seed- 592.08 1.28 g/ml Flower- 922.5 1.07 g/ml Green Banana- 4.418 1.23 mg/ml Ascorbic Acid- 141 0.06 g/ml 80 60 40 20 0 -20 -40 1 2 5 1 3 4 5 6 7 8 9 Concentration (Extract) Concentration (Ascorbic Acid) Seed Flower Green Banana Ascorbic Acid Concentration (Extract) 10 2 2.5 0.5 68.64 64.05 45.65 67.06 1.25 0.25 61.80 59.32 34.09 57.23 Seed 0.625 0.125 56.93 50.13 16.74 51.52 Flower 0.3125 0.0625 47.93 39.44 0.37 41.22 Green Banana 0.15625 0.03125 33.76 25.43 -12.21 29.74 0.078125 0.0390625 0.015625 0.0078125 16.20 20.14 -17.07 25.12 Ascorbic Acid 88.38 81.13 59.49 88.01 Concentration (Ascorbic Acid) 78.12 70.01 51.17 74.10 4.95 -11.73 -30.52 0.23
50 % Reduction- Seed- 156.76 2.21 g/ml Flower - 426.33 1.19 g/ml Green Banana - 2.63 2.11 mg/ml Ascorbic Acid- 30.23 0.07 g/ml Ferric Reducing Antioxidant Potential 100 80 60 40 20 0 -20 -40 1 2 3 4 5 6 7 8 9 1 1 10 2 2 11 4 Conc. 0.0625 0.0625 83.37 70.07 87.99 46.84 Seed 0.125 0.125 77.89 58.74 82.55 39.54 0.25 0.25 69.98 40.92 76.95 32.10 0.5 0.5 62.32 20.97 68.00 26.23 0.0039063 0.00781250.015625 0.03125 Flower Seed Green Banana Ascorbic Acid 34.10 -0.04 62.91 7.16 11.49 -15.00 52.46 -0.66 -16.03 -29.67 43.52 70.77 61.02 Conc. 57.46 52.64 Flower Green Banana Ascorbic Acid
IC50 - Seed 931.36 1.16 g/ml Flower 1.92 2.13 mg/ml Green Banana 5.81 3.31 mg/ml Ascorbic Acid 115.31 0.08 g/ml NO Radical Scavenging Activity 100 80 60 40 20 0 -20 -40 1 2 5 1 3 4 5 6 7 8 9 Conc. ( Extract) Conc. (Ascorbic Acid) SEED FLOWER GB Ascorbic Acid 10 2 2.5 0.5 66.22 49.59 36.79 68.96 1.25 0.25 56.57 46.68 24.62 60.44 0.625 0.125 40.25 37.96 12.32 50.14 0.3125 0.0625 35.83 20.56 0.39 41.26 0.15625 0.03125 20.65 11.99 -7.48 34.49 0.078125 0.0390625 0.015625 0.0078125 10.43 -4.33 -15.09 24.08 89.42 79.44 60.23 88.26 74.72 59.66 46.65 76.51 -1.92 -11.45 -33.72 15.31 Conc. ( Extract) Conc. (Ascorbic Acid) SEED FLOWER GB Ascorbic Acid