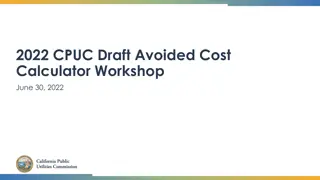
Draft Control Techniques Guidelines for Oil and Gas Sector Overview
This briefing covers the purpose, scope, and implementation of control techniques guidelines for the oil and natural gas sector, focusing on volatile organic compounds emissions. It includes details on the sector description, background, and coverage comparisons with NSPS proposals.

Download Presentation

Please find below an Image/Link to download the presentation.
The content on the website is provided AS IS for your information and personal use only. It may not be sold, licensed, or shared on other websites without obtaining consent from the author.If you encounter any issues during the download, it is possible that the publisher has removed the file from their server.
You are allowed to download the files provided on this website for personal or commercial use, subject to the condition that they are used lawfully. All files are the property of their respective owners.
The content on the website is provided AS IS for your information and personal use only. It may not be sold, licensed, or shared on other websites without obtaining consent from the author.
E N D
Presentation Transcript
Draft Control Techniques Guidelines for the Oil and Natural Gas Source Category Interagency Review Introductory Briefing July 29, 2015
Overview Purpose of this Briefing Oil and Gas Sector Description Scope of Coverage - Control Techniques Guidelines vs NSPS Background/Implementation Summary of RACT Recommendations Model Rule Estimate of Reductions and Cost Schedule 2 Deliberative - Do Not Cite or Quote
Oil and Gas Sector Description Natural gas systems encompass wells, gas gathering and processing facilities, storage, and transmission and distribution pipelines. 1 Production & Processing 1. Drilling and Well Completion 2. Producing Wells 3. Gathering Lines 4. Gathering and Boosting Stations 5. Gas Processing Plant 2 Crude Oil to Refineries (not included in this source category) 3 4 5 Natural Gas Transmission & Storage 6. Transmission Compressor Stations 7. Transmission Pipeline 8. Underground Storage 6 7 10a 10b 8 Distribution 9. Distribution Mains 10. Regulators and Meters for: a. City Gate b. Large Volume Customers c. Residential Customers d. Commercial Customer 9 10c 10d Natural gas distribution is currently out of the scope of the white papers and 2015 NSPS Proposed Rule Source: Adapted from American Gas Association and EPA Natural Gas STAR Program Deliberative - Do Not Cite or Quote
Background/Implementation Control Techniques Guidelines (CTG): Provide guidance to state, local and tribal air agencies to assist them in determining reasonably available control technology for volatile organic compounds from select sources. Applies to existing sources in ozone moderate, and higher, nonattainment areas and the Ozone Transport Region (OTR). Currently 151 counties are designated moderate or higher States in OTR - VA, PA, DC, MD, DE, NJ, NY, VT, NH, MA, RI, CT, ME States are required to submit revisions to their state implementation plans after a CTG is finalized. Timeline set when CTG is finalized Typically given one year to submit revisions States have flexibility to adopt RACT recommendations or can use them to inform their own determination. 4 Deliberative - Do Not Cite or Quote
Scope of Coverage Draft CTG vs. NSPS CTG (VOC) 2012, 2015 NSPS Proposal (VOC and/or GHG/Methane ) Emission Source Storage Vessels Across source category Across source category (VOC only) Production and processing, excluding well site compressors Across the source category, excluding well site compressors Compressors Wellhead through natural gas processing plant Pneumatic Controllers Across the source category Pneumatic Pumps Production and processing Across the source category Hydraulically fractured gas wells and hydraulically fractured oil wells Well Completions Not covered Natural gas processing plants Well sites and compressor stations (Production and processing) Equipment Leaks Fugitives Natural gas processing plants, well sites, and compressor stations Liquids Unloading Not covered Not covered 5 Deliberative - Do Not Cite or Quote
Summary of RACT Recommendations Storage vessels Across source category Ninety five percent reduction of VOC emissions from storage vessels with potential to emit greater than 6 tpy Compressors Production and processing, excluding well site Centrifugal Compressors Wet seal Reduce VOC emissions by 95% Dry seal not covered Reciprocating Compressors Reduce VOC emissions by replacing rod packing after 26,000 hours of operation or 36 calendar months, or Route emissions from the rod packing to a process through a closed vent system under negative pressure Pneumatic controllers Natural gas processing plants Natural gas bleed rate of zero standard cubic feet per hour (scfh) Wellhead to natural gas processing plant Natural gas bleed rate less than or equal to 6 scfh 6 Deliberative - Do Not Cite or Quote
Model Rule CTG includes model rule language Provides example regulatory text for air agencies to use in writing enforceable requirements Includes: Key definitions Identification of affected facilities (applicability) Emission control requirements Compliance and test methods Recordkeeping, reporting and monitoring Based on approach included in other CTG documents (e.g. Coating Operations at Aerospace Manufacturing and Rework Operations (December 1997)) Deliberative - Do Not Cite or Quote
Estimate of Reductions and Cost Potential emission reductions: VOC 113,974 tons per year Methane 338,381 tons per year HAP 4,227 tons per year Potential costs: Capital - $446M Annual (without savings) - $278M Annual (with savings) - $206M Based on current ozone moderate, and higher, nonattainment areas and the OTR. 9 Deliberative - Do Not Cite or Quote
Table 5-1. Summary of the ONG VOC RACT Emission Reductions and Costs VOC Cost of Control ($/ton) Type of Control Emission Reduction Per Unit (tpy) Emission Reductions (tpy) Costs ($) Emission Source Annual w/o savings ($/yr) Annual w/ savings ($/yr) VOC Methane HAP w/o savings w/ savings VOC Methane HAP Capital ($) Fugitive Emissions - Gas Well Sites Fugitive Emissions - Oil Well Sites Fugitive Emissions - Gathering and Boosting Stations Equipment Leaks - Processing Plants Semiannual OGI 0.76 2.72 0.03 $2,945 $2,111 31,424 113,046 1,184 33,244,088 92,555,240 66,350,133 Semiannual OGI 0.18 0.65 0.01 $12,294 $11,460 7,877 28,338 297 34,783,471 96,841,052 90,272,109 Semiannual OGI 5.86 21.09 0.22 $2,710 $1,876 5,047 18,155 190 9,465,294 13,673,740 9,465,294 NSPS Subpart VVa 4.56 16.39 0.17 $2,844 $2,010 228 820 9 424,950 647,957 457,974 Reciprocating Compressors - Gathering and Boosting Stations Reciprocating Compressors - Processing Replace Packing After 3 Years 1.90 6.84 0.07 $1,132 $298 7,371 26,518 278 21,888,661 8,340,711 2,193,981 Replace Packing After 3 Years 95% Control, Existing Combustion Device 4.89 17.58 0.18 $334 ($500) 2,267 8,156 85 1,986,033 756,827 (1,133,746) Centrifigal Compressors w/ Wet Seals - Processing 18.15 200.45 2.10 $182 $182 985 10,883 114 1,262,361 179,756 179,756 Natural Gas-Driven Pneumatic Controllers - Oil and Gas Production Natural Gas-Driven Pneumatic Controllers - Processing Replace w/ Low Bleed 1.41 5.10 0.05 $210 ($627) 30,933 111,616 1,169 59,046,994 6,483,043 (19,390,451) Existing Instrument Air System 0.28 1.00 0.01 $1,018 $190 3 11 0 22,277 3,175 592 Natural Gas-Driven Pneumatic Pumps - Production - Diaphram Natural Gas-Driven Pneumatic Pumps - Production - Piston 95% Control, Existing Combustion Device 95% Control, Existing Combustion Device 0.91 3.29 0.03 $312 $312 4,008 14,419 151 8,773,271 1,250,191 1,250,191 0.10 0.36 0.00 $2,840 $2,840 439 1,578 17 8,742,833 1,245,854 1,245,854 95% Control, Combustion/VRU Storage Vessels a a a a a 23,392 4,842 734 266,116,280 56,228,139 55,911,683 Total Note: Minor differences may result from rounding. 113,974 338,381 4,227 445,756,512 278,205,683 206,803,370 a - There are a wide variety of storage vessel sizes, as well as rates of throughput for each tank. Emissions and costs are directly related to the throughput of liquids for a given storage vessel. In lieu of using emission reductions and costs per storage vessel, we used production rate brackets developed by the U.S. Energy Information Administration (EIA) for our emission estimates and costs (see Attachments 2 and 3). 10
Schedule Milestones Dates Interagency Review July 2015 Draft Available for Comment Summer 2015 Final Spring 2016 11 Deliberative - Do Not Cite or Quote