Drivers and Impact Analysis for Overall IT Customer Satisfaction
Discover key drivers affecting Overall IT Customer Satisfaction (CSAT) and strategies to improve Low Satisfaction (LSAT) and Neutral CSAT scores. Learn about critical issues, performance by category, and service impacts to enhance CSAT levels effectively.

Download Presentation

Please find below an Image/Link to download the presentation.
The content on the website is provided AS IS for your information and personal use only. It may not be sold, licensed, or shared on other websites without obtaining consent from the author. If you encounter any issues during the download, it is possible that the publisher has removed the file from their server.
You are allowed to download the files provided on this website for personal or commercial use, subject to the condition that they are used lawfully. All files are the property of their respective owners.
The content on the website is provided AS IS for your information and personal use only. It may not be sold, licensed, or shared on other websites without obtaining consent from the author.
E N D
Presentation Transcript
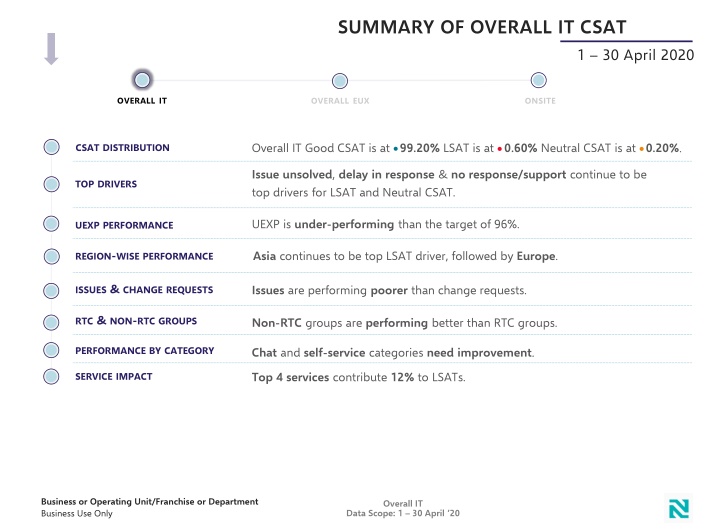
SUMMARY OF OVERALL IT CSAT 1 30 April 2020 OVERALLIT csat distribution CSATDISTRIBUTION Overall IT Good CSAT is at 99.20% LSAT is at 0.60% Neutral CSAT is at 0.20%. . Issue unsolved, , delay in response &no response/support continue to be top drivers for LSAT and Neutral CSAT. top drivers TOPDRIVERS UEXP is under-performingthan the target of 96%. UEXPPERFORMANCE REGION-WISEPERFORMANCE Asiacontinues to be top LSAT driver, followed by Europe. ISSUES & CHANGEREQUESTS Issues are performing poorer than change requests. RTC & NON-RTCGROUPS Non-RTCgroups are performing better than RTC groups. PERFORMANCEBYCATEGORY Chatandself-service categoriesneed improvement. . SERVICEIMPACT Top 4 services contribute12%to LSATs. Business or Operating Unit/Franchise or Department Business Use Only Overall IT Data Scope: 1 30 April 20
OVERALL IT GOOD CSAT IS AT 99.20%, LSAT IS AT 0.60%, NEUTRAL CSAT IS AT 0.20%. OVERALLIT Breakdown of CSAT survey responses csat distribution CSATDISTRIBUTION Good Responses top drivers Total Responses 10,756 99.20% 10,669 Poor Neutral Responses Responses 0.60% 0.20% 65 22 Effectively addressing poor & neutral responses will help improve the overall CSAT score. What are the key drivers of LSAT and Neutrals? How do services impact LSAT? Business or Operating Unit/Franchise or Department Business Use Only Overall IT Data Scope: 1 30 April 20
ISSUE UNSOLVED, DELAY IN RESPONSE & NO RESPONSE/SUPPORT CONTINUE TO BE THE TOP DRIVERS FOR LSAT AND NEUTRAL CSAT. OVERALLIT Poor CSAT Drivers csat distribution top drivers TOPDRIVERS Communicating the estimated response time & requiring confirmation before closing the ticket could reduce LSAT by 42%. Neutral CSAT Drivers How has the UEXP performance been impacted? How do services impact LSAT? Business or Operating Unit/Franchise or Department Business Use Only Overall IT Data Scope: 1 30 April 20
SUMMARY OF OVERALL EUX CSAT 1 30 April 2020 OVERALLIT csat distribution CSATDISTRIBUTION Overall IT Good CSAT is at 99.20% LSAT is at 0.60% Neutral CSAT is at 0.20%. . Issue unsolved, , delay in response &no response/support continue to be top drivers for LSAT and Neutral CSAT. top drivers TOPDRIVERS UEXP is under-performingthan the target of 96%. UEXPPERFORMANCE REGION-WISEPERFORMANCE Asiacontinues to be top LSAT driver, followed by Europe. ISSUES & CHANGEREQUESTS Issues are performing poorer than change requests. RTC & NON-RTCGROUPS Non-RTCgroups are performing better than RTC groups. PERFORMANCEBYCATEGORY Chatandself-service categoriesneed improvement. . SERVICEIMPACT Top 4 services contribute12%to LSATs. Business or Operating Unit/Franchise or Department Business Use Only Overall IT Data Scope: 1 30 April 20