Dropsonde Behavior in High Wind and Turbulence Regimes
Explore the behavior of dropsondes in high wind and turbulence regimes, as observed during NOAA aircraft sampling of major hurricanes such as Florence, Michael, and Lane. Discover the characteristics of updrafts, downdrafts, and vertical velocities, providing insights into the dynamics of severe weather phenomena.
Download Presentation

Please find below an Image/Link to download the presentation.
The content on the website is provided AS IS for your information and personal use only. It may not be sold, licensed, or shared on other websites without obtaining consent from the author. If you encounter any issues during the download, it is possible that the publisher has removed the file from their server.
You are allowed to download the files provided on this website for personal or commercial use, subject to the condition that they are used lawfully. All files are the property of their respective owners.
The content on the website is provided AS IS for your information and personal use only. It may not be sold, licensed, or shared on other websites without obtaining consent from the author.
E N D
Presentation Transcript
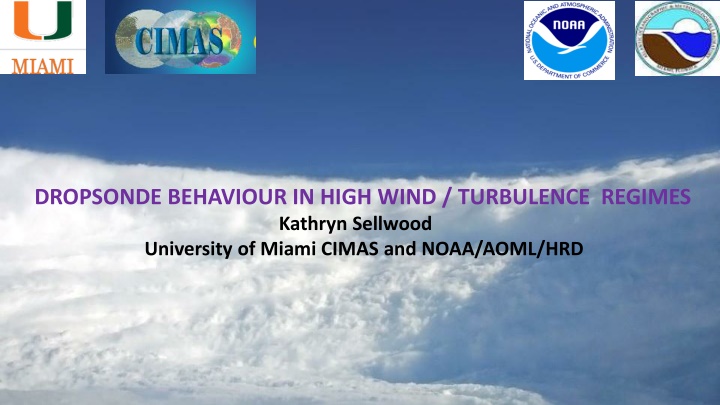
DROPSONDE BEHAVIOUR IN HIGH WIND / TURBULENCE REGIMES Kathryn Sellwood University of Miami CIMAS and NOAA/AOML/HRD
2018: NOAA AIRCRAFT SAMPLED 3 MAJOR HURRICANES Florence in the tropical Atlantic Sept. 8-12 Michael in the Gulf of Mexico Oct 8-10 Lane in the Central Pacific Aug. 19-22 STORM TOTAL SONDES UPDRAFT > 10 m/s DOWNDRAFT < -10 m/s UPSONDES WINDS > 100kts LANE 135 11 6 9 50 FLORENCE 118 1 4 0 22 MICHAEL 163 3 11 1 42
UPSONDES Vertical velocities great enough to propel dropsonde upward Associated with eyewall region Major updraft above the boundary layer ~ 1500m Large vertical wind speeds throughout the boundary layer Very strong horizontal winds from below updraft to surface Radially fluctuating motion SONDES WITH BOTH LARGE UPDRAFTS AND DOWNDRAFTS Also in eyewall region Far more common than upsondes Large updraft above boundary layer + Large downdraft closer to surface Wind maxima near level of both upward and downward vertical velocity maxima Strong horizontal winds to surface Little radial motion SONDES WITH LARGE DOWNDRAFTS Flagged as possible fast fall ( may cause ASPEN to crash unexpectedly) Eyewall slightly outside Moist cool layer (probable cloud) Strong horizontal winds below Radially fluctuating motion
21 m/s updraft observed in Hurricane Lane 08/21 5:21Z Upward sonde motion for > 1 minute (800-1500m) Pressure / Altitude Vertical wind Speed
Updraft region: Vertical wind Speed Horizontal wind Speed / Direction
High winds extend to surface Radial wind fluctuations Horizontal wind Speed / Direction
14m/s Updraft above boundary layer - local wind max below 5m/s Downdraft within boundary layer - local wind max above Horizontal wind Speed / Direction Vertical wind Speed
High winds extend to surface Less radial fluctuation Horizontal wind Speed / Direction
Wind Profile: 15m/s downdraft + multiple downward vertical wind gusts Horizontal wind Speed / Direction Vertical wind Speed
Sharp gradients and extreme values caused many good wind data flagged by ASPEN QC procedures No surface wind values produced without unflagging multiple data points Difficult to determine which points to retain Value of surface wind in Tempdrop message strongly dependent on the choice of observations retained and QC parameters for wind Default parameters found to be too strict for the observed winds Buddy Check slope of 1.5 m/s2 increased to 4.5 m/s2 Default value to be increased to 10 m/s2 for 2019 Outlier check increased from 5 to 10 std. Larger Buddy check slope should make this unnecessary No adjustment to vertical velocity 2.5 m/s Move towards a uniform approach to processing extreme sondes
Surface Wind Speed coding may vary, depending on retained observations and QC parameters UZPN13 KWBC XXAA 71088 99141 71511 05241 99965 24600 00639 00813 ///// ///// 92372 22400 04155 85107 19400 07148 88999 77999 31313 09608 80743 61616 AF100 WXWXA TRAIN OB 99 62626 MBL WND 03147 AEV 33666 DLM WND 06128 965750 WL150 01654 07 6 REL 1407N15111W 074349 SPG 1402N15122W 074714 = UZPN13 KWBC XXAA 71088 99141 71511 05241 99965 24600 00640 00813 ///// ///// 92372 22400 04155 85107 19400 07147 88999 77999 31313 09608 80743 61616 AF100 WXWXA TRAIN OB 99 62626 MBL WND 03148 AEV 33666 DLM WND 06128 965750 WL150 01654 07 7 REL 1407N15111W 074349 SPG 1402N15122W 074716 = UZPN13 KWBC XXAA 71088 99141 71511 05241 99965 24600 01139 00813 ///// ///// 92372 22400 04155 85107 19400 07147 88999 77999 31313 09608 80743 61616 AF100 WXWXA TRAIN OB 99 62626 MBL WND 03148 AEV 33666 DLM WND 06128 965750 WL150 01655 08 0 REL 1407N15111W 074349 SPG 1402N15122W 074715 =
2019 ASPEN training QC procedure document and powerpoint to be available via Google drive Set of practice dropsondes to process prior to in-person or online training Completion of practice sondes and training required for field program participation as dropsonde scientist Will use 2019 operational version of AVAPS Practice dropsondes should be available by end of May Examples of problem sondes will be included In person (go to meeting available) training in early June Plan is to record training session and place on Google drive Contact myself kathryn.sellwood@noaa.gov to share Google drive folder and / or to be added to email list
FUTURE CONSIDERATIONS - Move to BUFR format may produce more extreme observations - Tempdrop constrains significant levels - How can we avoid sending bad data in BUFR? - Should we thin BUFR data? - How to thin? - OSE experiments in process


