Drug Overdose Deaths Analysis in Tennessee 2015-2019
This data analysis focuses on drug overdose deaths in Tennessee from 2015 to 2019, covering various aspects such as total deaths, breakdown by sex and race, contributing substances, and more. The information reveals trends, patterns, and insights into the opioid crisis in the state, highlighting the impact on different demographics.

Uploaded on Mar 10, 2025 | 3 Views
Download Presentation

Please find below an Image/Link to download the presentation.
The content on the website is provided AS IS for your information and personal use only. It may not be sold, licensed, or shared on other websites without obtaining consent from the author.If you encounter any issues during the download, it is possible that the publisher has removed the file from their server.
You are allowed to download the files provided on this website for personal or commercial use, subject to the condition that they are used lawfully. All files are the property of their respective owners.
The content on the website is provided AS IS for your information and personal use only. It may not be sold, licensed, or shared on other websites without obtaining consent from the author.
E N D
Presentation Transcript
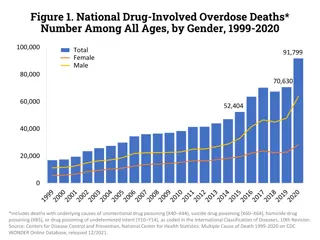
Drug Overdose Deaths in Tennessee, 2015-2019 2,500 2,089 2,000 1,818 1,776 Number of Deaths 1,631 1,451 1,500 1,000 500 0 2015 2016 2017 2018 2019 Source: Tennessee Department of Health, Office of Informatics and Analytics
All Drug Overdose Deaths by Sex, 2015-2019 1500 1,353 1350 1200 1,085 1,033 1050 949 Number of Deaths 900 Male 811 743 735 733 Female 750 682 640 600 450 300 150 0 2015 2016 2017 2018 2019 Source: Tennessee Department of Health, Office of Informatics and Analytics
All Drug Overdose Deaths by Race, 2015-2019 1,752 1800 1,617 1,547 1600 1,440 1400 1,250 1200 Number of Deaths White 1000 Black 800 600 400 320 217 193 178 200 128 0 2015 2016 2017 2018 2019 Source: Tennessee Department of Health, Office of Informatics and Analytics
All Drug Overdose Deaths by Race and Sex, 2015-2019 100 89 88 87 86 84 80 Percentage of Overdose Death 65 60 58 58 60 56 Percent White Percent Male 40 20 0 2015 2016 2017 2018 2019 Source: Tennessee Department of Health, Office of Informatics and Analytics
Number of people who died of a drug overdose in Tennessee by contributing substance, 2015-2019 (n= 8,765) Overdose Death 2015 2016 2017 2018 2019 1,451 1,631 1,776 1,818 2,089 All Drug 1,034 1,186 1,268 1,304 1,543 Opioid Pain Relievers (per CDC Definition, includes methadone) Heroin 689 739 644 548 515 205 260 311 367 380 169 294 500 742 1,087 Fentanyl 67 82 69 66 53 Methadone 492 573 504 409 395 Benzodiazepine 447 522 447 354 363 Opioid and Benzodiazepine 112 187 319 462 651 Stimulants other than Cocaine 203 250 306 251 334 Cocaine 65 111 177 281 409 Opioids and Stimulants Source: Tennessee Department of Health, Office of Informatics and Analytics
Number of people who died of a drug overdose in Tennessee by contributing substance, 2015-2019 (n= 8,765) 2015 2016 2017 2018 2019 Overdose Death CountPercentRate CountPercentRate CountPercentRate CountPercentRateCountPercentRate 1,451 100 22 1,631 100 25 1,776 100 26 1,818 100 27 2,089 100 31 All Drug 1,034 71 16 1,186 73 18 1,268 71 19 1,304 72 19 1,543 73 23 Opioid Pain Relievers (per CDC Definition, includes methadone) 689 48 10 739 45 11 644 36 10 548 30 8 515 25 8 205 14 3 260 16 4 311 18 5 367 20 5 380 18 6 Heroin 169 12 3 294 18 4 500 28 7 742 41 11 1,087 52 16 Fentanyl 67 5 1 82 5 1 69 4 1 66 4 1 53 3 1 Methadone 492 34 7 573 35 9 504 28 8 409 22 6 395 19 6 Benzodiazepine Opioid and Benzodiazepine Stimulants other than Cocaine 447 31 7 522 32 8 447 25 7 354 19 5 363 17 5 112 8 2 187 11 3 319 18 5 462 25 6 651 31 6 203 14 3 250 15 4 306 17 5 251 14 3 334 16 3 Cocaine 65 4 1 111 7 2 177 10 3 281 15 4 409 20 4 Opioids and Stimulants Rate is per 100,000 persons. Rates & percentages have been rounded to nearest whole number. Source: Tennessee Department of Health, Office of Informatics and Analytics
Number of Overdose Deaths in Tennessee by Drug Type, 2015-2019 2500 2089 2000 1818 1776 Number of Deaths 1631 1543 1451 All drug overdose Any opioid Pain Relievers Heroin Fentanyl 1500 1304 1268 1186 1087 1034 1000 739 744 689 644 548 515 501 500 295 205 380 367 311 260 169 0 2015 2016 2017 2018 2019 Source: Tennessee Department of Health, Office of Informatics and Analytics
Deaths by type as a percent of all overdoses, 2015-2019 100 90 80 73 73 72 71 71 70 All Drug Opioid Pain Relievers Heroin Fentanyl Methadone Benzodiazepine Opioid and Benzodiazepine Number of Deaths 60 52 48 50 45 41 40 36 35 34 32 31 30 28 28 30 25 25 22 20 19 19 18 18 18 20 17 16 14 12 10 5 5 4 4 3 0 2015 2016 2017 2018 2019 Source: Tennessee Department of Health, Office of Informatics and Analytics
Trends in overdose deaths by drug type (percent of overdose deaths), 2015-2019 100 80 73 73 72 71 71 Number of Deaths Opioid 60 Pain Relievers 52 Heroin 48 45 Fentanyl 41 Methadone 40 36 35 34 Benzodiazepine 30 Linear (Fentanyl) 28 28 25 22 20 19 18 18 18 20 16 14 12 5 5 4 4 3 0 2015 2016 2017 2018 2019 Drug types are not mutually exclusive, so will not sum to 100% Source: Tennessee Department of Health, Office of Informatics and Analytics
Trends in overdose deaths by type (numbers of overdose deaths), 2015-2019 2,500 2,089 2,000 1,818 1,776 1,631 Number of Deaths 1,543 1,451 1,500 All Drug Opioid Pain Relievers Heroin Fentanyl Benzodiazepine 1,304 1,268 1,186 1,087 1,034 1,000 742 739 689 644 573 548 515 504 500 492 500 409 395 380 367 311 294 260 205 169 0 2015 2016 2017 2018 2019 Drug types are not mutually exclusive, so will not sum to overdose death totals Source: Tennessee Department of Health, Office of Informatics and Analytics
Number of people who died of a stimulant drug overdose in Tennessee, 2015-2019 (n= 8,765) Overdose Death 2015 2016 2017 2018 2019 301 413 587 671 910 Any stimulant 112 187 319 462 651 Stimulants other than Cocaine 203 250 306 251 334 Cocaine 205 260 311 367 380 Opioids and Cocaine Opioids and Stimulants other than cocaine 65 111 177 281 409 177 246 342 421 579 Opioids and any Stimulant Source: Tennessee Department of Health, Office of Informatics and Analytics
Number of Stimulant Overdose Deaths in Tennessee, 2015-2019 Source: Tennessee Department of Health, Office of Informatics and Analytics
All Drug Deaths by Age Distribution, 2015-2019 600 500 400 Number of Deaths 2015 2016 2017 2018 2019 300 200 100 0 15-24 years 25-34 years 35-44 years 45-54 years 55-64 years 65-74 years 75-84 years 85+ years Source: Tennessee Department of Health, Office of Informatics and Analytics
All Drug Deaths by Age Distribution, 2015-2019 550 500 450 400 15-24 years 25-34 years 35-44 years 45-54 years 55-64 years 65-74 years 75-84 years 85+ years Number of Deaths 350 300 250 200 150 100 50 0 2015 2016 2017 2018 2019 Source: Tennessee Department of Health, Office of Informatics and Analytics
Opioid specific data Source: Tennessee Department of Health, Office of Informatics and Analytics
Opioids Present In Overdose Deaths, 2015-2019* 100 Percentage of Opioid Overdose Death 80 73 73 72 71 71 60 52 Opioid Fentanyl Heroin 41 40 28 20 18 18 18 20 16 14 12 0 2015 2016 2017 2018 2019 * Percentages for fentanyl and heroin are included in the opioid category and are broken out for clarity. Source: Tennessee Department of Health, Office of Informatics and Analytics
Opioids Present In Overdose Deaths, 2015-2019* 100 Percentage of Opioid Overdose Death 80 73 73 72 71 71 Opioid Fentanyl Heroin Buprenorphine 60 52 41 40 28 20 18 18 18 20 16 14 12 5 4 4 3 3 0 2015 2016 2017 2018 2019 * Percentages for fentanyl, heroin, buprenorphine are included in the opioid category and are broken out for clarity. Source: Tennessee Department of Health, Office of Informatics and Analytics
All Opioid Overdose Deaths by Sex, 2015-2019 1200 1,021 1050 900 805 743 Number of Deaths 750 686 Male 603 Female 600 525 521 500 499 431 450 300 150 0 2015 2016 2017 2018 2019 Source: Tennessee Department of Health, Office of Informatics and Analytics
All Opioid Overdose Deaths by Race, 2015-2019 1600 1400 1,303 1,164 1200 1,127 1,064 Number of Deaths 1000 919 White Black 800 600 400 225 200 135 133 112 64 0 2015 2016 2017 2018 2019 Source: Tennessee Department of Health, Office of Informatics and Analytics
All Opioid Overdose Deaths by Race and Sex, 2015-2019 100 90 89 89 89 84 Percentage of Opioid Overdose Death 80 66 62 59 58 58 60 Percent White Percent Male 40 20 0 2015 2016 2017 2018 2019 Source: Tennessee Department of Health, Office of Informatics and Analytics
All Opioid Deaths by Age Distribution, 2015-2019 500 450 400 Number of Deaths 350 2015 2016 2017 2018 2019 300 250 200 150 100 50 0 15-24 years 25-34 years 35-44 years 45-54 years 55-64 years 65-74 years 75-84 years 85+ years Source: Tennessee Department of Health, Office of Informatics and Analytics
All Opioid Deaths by Age Distribution, 2015-2019 500 450 400 350 15-24 years 25-34 years 35-44 years 45-54 years 55-64 years 65-74 years 75-84 years 85+ years Number of Deaths 300 250 200 150 100 50 0 2015 2016 2017 2018 2019 Source: Tennessee Department of Health, Office of Informatics and Analytics
Pain relievers Source: Tennessee Department of Health, Office of Informatics and Analytics
All Pain Reliever Overdose Deaths by Sex, 2015-2019 500 450 390 400 370 349 350 329 319 315 Number of Deaths 300 285 300 Male 263 Female 250 215 200 150 100 50 0 2015 2016 2017 2018 2019 Source: Tennessee Department of Health, Office of Informatics and Analytics
All Pain Reliever Overdose Deaths by Race, 2015-2019 800 680 700 638 582 600 495 Number of Deaths 500 452 White Black 400 300 200 100 62 58 55 50 29 0 2015 2016 2017 2018 2019 Source: Tennessee Department of Health, Office of Informatics and Analytics
All Pain Reliever Overdose Deaths by Race and Sex, 2015-2019 100 93 92 90 90 88 Percentage of Pain Reliever Overdose Death 80 58 60 54 53 52 51 Percent White Percent Male 40 20 0 2015 2016 2017 2018 2019 Source: Tennessee Department of Health, Office of Informatics and Analytics
Pain Reliever Deaths by Age Distribution, 2015-2019 250 200 Number of Deaths 2015 2016 2017 2018 2019 150 100 50 0 15-24 years 25-34 years 35-44 years 45-54 years 55-64 years 65-74 years 75-84 years 85+ years Source: Tennessee Department of Health, Office of Informatics and Analytics
Pain Reliever Deaths by Age Distribution, 2015-2019 250 200 15-24 years 25-34 years 35-44 years 45-54 years 55-64 years 65-74 years 75-84 years 85+ years Number of Deaths 150 100 50 0 2015 2016 2017 2018 2019 Source: Tennessee Department of Health, Office of Informatics and Analytics
Heroin Source: Tennessee Department of Health, Office of Informatics and Analytics
All Heroin Overdose Deaths by Sex, 2015-2019 350 300 265 257 250 Number of Deaths 216 Male 200 182 Female 149 150 115 110 95 100 78 56 50 0 2015 2016 2017 2018 2019 Source: Tennessee Department of Health, Office of Informatics and Analytics
All Heroin Overdose Deaths by Race, 2015-2019 400 324 319 300 270 Number of Deaths 222 White Black 200 156 100 53 45 40 34 26 0 2015 2016 2017 2018 2019 Source: Tennessee Department of Health, Office of Informatics and Analytics
All Heroin Overdose Deaths by Race and Sex, 2015-2019 100 87 87 85 85 Percentage of Heroin Overdose Death 80 76 73 70 70 70 69 60 Percent White Percent Male 40 20 0 2015 2016 2017 2018 2019 Source: Tennessee Department of Health, Office of Informatics and Analytics
All Heroin Deaths by Age Distribution, 2015-2019 140 120 100 Number of Deaths 2015 2016 2017 2018 2019 80 60 40 20 0 15-24 years 25-34 years 35-44 years 45-54 years 55-64 years 65-74 years 75-84 years 85+ years Source: Tennessee Department of Health, Office of Informatics and Analytics
All Heroin Deaths by Age Distribution, 2015-2019 140 120 100 15-24 years 25-34 years 35-44 years 45-54 years 55-64 years 65-74 years 75-84 years 85+ years Number of Deaths 80 60 40 20 0 2015 2016 2017 2018 2019 Source: Tennessee Department of Health, Office of Informatics and Analytics
Fentanyl Source: Tennessee Department of Health, Office of Informatics and Analytics
All Fentanyl Overdose Deaths by Sex, 2015-2019 900 800 756 700 600 Number of Deaths 531 Male 500 Female 400 335 330 300 213 196 200 166 108 99 100 61 0 2015 2016 2017 2018 2019 Source: Tennessee Department of Health, Office of Informatics and Analytics
All Fentanyl Overdose Deaths by Race, 2015-2019 1000 887 900 800 700 643 Number of Deaths 600 White Black 500 422 400 300 242 190 200 151 99 77 100 50 16 0 2015 2016 2017 2018 2019 Source: Tennessee Department of Health, Office of Informatics and Analytics
All Fentanyl Overdose Deaths by Race and Sex, 2015-2019 100 89 86 84 Percentage of Fentanyl Overdose Death 82 82 80 71 70 67 67 64 60 Percent White Percent Male 40 20 0 2015 2016 2017 2018 2019 Source: Tennessee Department of Health, Office of Informatics and Analytics
All Fentanyl Deaths by Age Distribution, 2015-2019 400 350 300 Number of Deaths 250 2015 2016 2017 2018 2019 200 150 100 50 0 15-24 years 25-34 years 35-44 years 45-54 years 55-64 years 65-74 years 75-84 years 85+ years Source: Tennessee Department of Health, Office of Informatics and Analytics
All Fentanyl Deaths by Age Distribution, 2015-2019 400 350 300 15-24 years 25-34 years 35-44 years 45-54 years 55-64 years 65-74 years 75-84 years 85+ years Number of Deaths 250 200 150 100 50 0 2015 2016 2017 2018 2019 Source: Tennessee Department of Health, Office of Informatics and Analytics
Stimulants other than cocaine Source: Tennessee Department of Health, Office of Informatics and Analytics
All Stimulants (other than Cocaine) Overdose Deaths by Sex, 2015-2019 500 450 422 400 350 Number of Deaths 302 300 Male Female 250 229 187 200 160 150 132 121 100 72 66 40 50 0 2015 2016 2017 2018 2019 Source: Tennessee Department of Health, Office of Informatics and Analytics
All Stimulants (other than Cocaine) Overdose Deaths by Race, 2015-2019 596 600 500 442 400 Number of Deaths White 301 Black 300 200 178 102 100 50 20 15 6 3 0 2015 2016 2017 2018 2019 Source: Tennessee Department of Health, Office of Informatics and Analytics
All Stimulants (other than Cocaine) Overdose Deaths by Race and Sex, 2015-2019 100 96 95 94 92 91 Percentage of Stimulant Overdose Death 80 65 65 65 64 59 60 Percent White Percent Male 40 20 0 2015 2016 2017 2018 2019 Source: Tennessee Department of Health, Office of Informatics and Analytics
Stimulants (other than Cocaine) Deaths by Age Distribution, 2015-2019 200 180 160 140 Number of Deaths 2015 2016 2017 2018 2019 120 100 80 60 40 20 0 15-24 years 25-34 years 35-44 years 45-54 years 55-64 years 65-74 years 75-84 years 85+ years Source: Tennessee Department of Health, Office of Informatics and Analytics
Stimulants (other than Cocaine) Deaths by Age Distribution, 2015-2019 200 180 160 140 15-24 years 25-34 years 35-44 years 45-54 years 55-64 years 65-74 years 75-84 years 85+ years Number of Deaths 120 100 80 60 40 20 0 2015 2016 2017 2018 2019 Source: Tennessee Department of Health, Office of Informatics and Analytics
Combination of opioids and stimulants Source: Tennessee Department of Health, Office of Informatics and Analytics


 Overdose Deaths by")
 Overdose Deaths by")
 Overdose Deaths by")
 Deaths by Age")
 Deaths by Age")