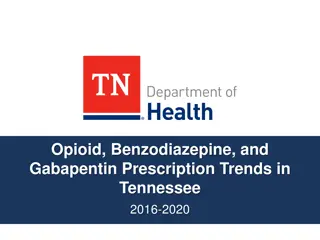
Drug Overdose Deaths in Tennessee, 2013-2017
The data presents a detailed analysis of drug overdose deaths in Tennessee from 2013 to 2017, including the number of deaths, breakdown by contributing substances, rates, and percentages. It highlights the impact of various substances such as opioids, heroin, fentanyl, methadone, benzodiazepine, and stimulants on overdose fatalities. The information is sourced from the Tennessee Department of Health, Office of Informatics and Analytics.

Download Presentation

Please find below an Image/Link to download the presentation.
The content on the website is provided AS IS for your information and personal use only. It may not be sold, licensed, or shared on other websites without obtaining consent from the author.If you encounter any issues during the download, it is possible that the publisher has removed the file from their server.
You are allowed to download the files provided on this website for personal or commercial use, subject to the condition that they are used lawfully. All files are the property of their respective owners.
The content on the website is provided AS IS for your information and personal use only. It may not be sold, licensed, or shared on other websites without obtaining consent from the author.
E N D
Presentation Transcript
Drug Overdose Deaths in Tennessee, 2013-2017 2,000 1,776 1,800 1,631 1,600 Number of Deaths 1,451 1,400 1,263 1,166 1,200 1,000 800 600 400 200 0 2013 2014 2015 2016 2017 Source: Tennessee Department of Health, Office of Informatics and Analytics
All Drug Overdose Deaths by Race and Sex, 2013-2017 100 92 91 88 87 86 90 80 70 58 58 57 56 60 54 Percent White Percent Male 50 40 30 20 10 0 2013 2014 2015 2016 2017
Number of people who died of a drug overdose in Tennessee by contributing substance, 2013-2017 (n= 7,287) Overdose Death 2013 2014 2015 2016 2017 1,166 1,263 1,451 1,631 1,776 All Drug 754 861 1,034 1,186 1,268 Opioid Pain Relievers (per CDC Definition, includes methadone) Heroin 578 603 689 739 644 63 147 205 260 311 53 69 169 294 500 Fentanyl 86 71 67 82 69 Methadone 371 388 492 573 504 Benzodiazepine 340 352 447 522 447 Opioid and Benzodiazepine 80 73 112 187 319 Stimulants other than Cocaine 130 134 203 250 306 Cocaine 56 49 65 111 177 Opioids and Stimulants
Number of people who died of a drug overdose in Tennessee by contributing substance, 2013-2017 (n= 7,287) 2013 2014 2015 2016 2017 Overdose Death CountPercentRate CountPercentRate CountPercentRate CountPercentRateCountPercentRate 1,166 100 18 1,263 100 19 1,451 100 22 1,631 100 25 1,776 100 26 All Drug 754 65 12 861 68 13 1,034 71 16 1,186 73 18 1,268 71 19 Opioid Pain Relievers (per CDC Definition, includes methadone) 578 50 9 603 48 9 689 48 10 739 45 11 644 36 10 63 5 1 147 12 2 205 14 3 260 16 4 311 18 5 Heroin 53 5 1 69 6 1 169 12 3 294 18 4 500 28 7 Fentanyl 86 7 1 71 6 1 67 5 1 82 5 1 69 4 1 Methadone 371 32 6 388 31 6 492 34 7 573 35 9 504 28 8 Benzodiazepine Opioid and Benzodiazepine Stimulants other than Cocaine 340 29 5 352 28 5 447 31 7 522 32 8 447 25 7 80 7 1 73 6 1 112 8 2 187 11 3 319 18 5 130 11 2 134 11 2 203 14 3 250 15 4 306 17 5 Cocaine 56 5 1 49 4 1 65 4 1 111 7 2 177 10 3 Opioids and Stimulants Rate is per 100,000 persons. Rates & percentages have been rounded to nearest whole number.
Number of Overdose Deaths in Tennessee by Drug Type, 2013-2017 2000 1776 1800 1631 1600 1451 1400 1268 1263 1186 1166 All drug overdose Any opioid Pain Relievers Heroin Fentanyl 1200 1034 1000 861 754 739 800 689 644 603 578 600 500 400 294 205 147 311 200 260 63 169 69 0 53 2013 2014 2015 2016 2017
Deaths by type as a percent of all overdoses, 2013-2017 100 90 80 73 71 71 68 70 65 All Drug 60 Opioid Pain Relievers 50 Heroin 48 48 50 45 Fentanyl Methadone 40 36 Benzodiazepine 35 34 32 32 Opioid and Benzodiazepine 31 31 29 28 28 28 30 25 18 18 20 16 14 12 12 10 7 6 6 5 5 5 5 4 0 2013 2014 2015 2016 2017
Trends in overdose deaths by drug type (percent of overdose deaths), 2013-2017 100 90 80 73 71 71 68 70 65 Opioid 60 Pain Relievers Heroin 50 48 48 50 Fentanyl 45 Methadone 40 36 Benzodiazepine 35 34 32 Linear (Fentanyl) 31 28 28 30 18 18 20 16 14 12 12 10 7 6 6 5 5 5 5 4 0 2013 2014 2015 2016 2017 Drug types are not mutually exclusive, so will not sum to 100%
Trends in overdose deaths by type (numbers of overdose deaths), 2013-2017 2,000 1,776 1,800 1,631 1,600 1,451 1,400 1,263 1,268 1,186 1,166 All Drug 1,200 Opioid 1,034 Pain Relievers 1,000 861 Heroin 754 800 Fentanyl 739 689 644 Benzodiazepine 603 578 573 600 Linear (Fentanyl) 504 500 492 388 371 400 311 294 260 205 169 147 200 69 63 53 0 2013 2014 2015 2016 2017 -200 Drug types are not mutually exclusive, so will not sum to overdose death totals
All Drug Deaths by Age Distribution, 2013-2017 500 450 400 Number of Deaths 350 300 2013 2014 2015 2016 2017 250 200 150 100 50 0 <1 year 1-4 years 5-14 years 15-24 years25-34 years35-44 years45-54 years55-64 years65-74 years75-84 years 85+ years
All Drug Deaths by Age Distribution, 2013-2017 500 450 400 Number of Deaths 350 300 2013 2014 2015 2016 2017 250 200 150 100 50 0 5-14 years 15-24 years 25-34 years 35-44 years 45-54 years 55-64 years 65-74 years 75-84 years 85+ years
All Drug Deaths by Age Distribution, 2013-2017 500 450 400 15-24 years 25-34 years 35-44 years 45-54 years 55-64 years 65-74 years 75-84 years 85+ years 350 Number of Deaths 300 250 200 150 100 50 0 2013 2014 2015 2016 2017
All Opioid Overdose Deaths by Race and Sex, 2013-2017 100 94 93 90 89 89 90 80 70 59 59 58 58 60 54 Percent White Percent Male 50 40 30 20 10 0 2013 2014 2015 2016 2017
Opioids Present In Overdose Deaths, 2013-2017* 100 90 Percentage of Overdose Death 80 73 71 71 68 70 65 60 50 Opioid Fentanyl Heroin 40 28 30 18 18 20 14 16 12 12 10 6 5 5 0 2013 2014 2015 2016 2017 * Percentages for fentanyl and heroin are included in the opioid category and are broken out for clarity.
Opioids Present In Overdose Deaths, 2013-2017* 100 90 Percentage of Overdose Death 80 73 71 Opioid 71 68 70 65 Fentanyl Heroin 60 Buprenorphine 50 40 28 30 18 18 20 16 14 12 12 10 6 5 5 4 4 4 3 2 0 2013 2014 2015 2016 2017 * Percentages for fentanyl, heroin, buprenorphine are included in the opioid category and are broken out for clarity.
All Opioid Deaths by Age Distribution, 2013-2017 350 300 250 Number of Deaths 2013 2014 2015 2016 2017 200 150 100 50 0 5-14 years 15-24 years 25-34 years 35-44 years 45-54 years 55-64 years 65-74 years 75-84 years 85+ years
All Opioid Deaths by Age Distribution, 2013-2017 350 300 15-24 years 25-34 years 35-44 years 45-54 years 55-64 years 65-74 years 75-84 years 85+ years 250 Number of Deaths 200 150 100 50 0 2013 2014 2015 2016 2017
All Pain Reliever Overdose Deaths by Race and Sex, 2013-2017 100 95 94 93 92 90 90 80 70 56 60 54 53 53 51 Percent White Percent Male 50 40 30 20 10 0 2013 2014 2015 2016 2017
Pain Reliever Deaths by Age Distribution, 2013-2017 250 200 Number of Deaths 150 2013 2014 2015 2016 2017 100 50 0 5-14 years 15-24 years 25-34 years 35-44 years 45-54 years 55-64 years 65-74 years 75-84 years 85+ years
Pain Reliever Deaths by Age Distribution, 2013-2017 250 200 15-24 years 25-34 years 35-44 years 45-54 years 55-64 years 65-74 years 75-84 years 85+ years Number of Deaths 150 100 50 0 2013 2014 2015 2016 2017
All Heroin Overdose Deaths by Race and Sex, 2013-2017 100 87 87 90 85 84 79 76 80 73 73 70 69 70 60 Percent White Percent Male 50 40 30 20 10 0 2013 2014 2015 2016 2017
All Heroin Deaths by Age Distribution, 2013-2017 100 90 80 Number of Deaths 70 60 2013 2014 2015 2016 2017 50 40 30 20 10 0 5-14 years 15-24 years 25-34 years 35-44 years 45-54 years 55-64 years 65-74 years 75-84 years 85+ years
All Heroin Deaths by Age Distribution, 2013-2017 100 90 80 15-24 years 25-34 years 35-44 years 45-54 years 55-64 years 65-74 years 75-84 years 85+ years 70 Number of Deaths 60 50 40 30 20 10 0 2013 2014 2015 2016 2017
All Fentanyl Overdose Deaths by Race and Sex, 2013-2017 100 94 94 89 90 84 82 80 68 67 67 70 64 60 53 Percent White Percent Male 50 40 30 20 10 0 2013 2014 2015 2016 2017
All Fentanyl Deaths by Age Distribution, 2013-2017 180 160 140 Number of Deaths 120 2013 2014 2015 2016 2017 100 80 60 40 20 0 5-14 years 15-24 years 25-34 years 35-44 years 45-54 years 55-64 years 65-74 years 75-84 years 85+ years
All Fentanyl Deaths by Age Distribution, 2013-2017 180 160 140 15-24 years 25-34 years 35-44 years 45-54 years 55-64 years 65-74 years 75-84 years 85+ years 120 Number of Deaths 100 80 60 40 20 0 2013 2014 2015 2016 2017
All Stimulants other than Cocaine Overdose Deaths by Race and Sex, 2013-2017 100 95 95 94 93 91 90 80 67 70 65 64 61 59 60 Percent White Percent Male 50 40 30 20 10 0 2013 2014 2015 2016 2017
Stimulants other than Cocaine Deaths by Age Distribution, 2013-2017 100 90 80 Number of Deaths 70 60 2013 2014 2015 2016 2017 50 40 30 20 10 0 5-14 years 15-24 years 25-34 years 35-44 years 45-54 years 55-64 years 65-74 years 75-84 years 85+ years
Stimulants other than Cocaine Deaths by Age Distribution, 2013-2017 100 90 80 15-24 years 25-34 years 35-44 years 45-54 years 55-64 years 65-74 years 75-84 years 85+ years 70 Number of Deaths 60 50 40 30 20 10 0 2013 2014 2015 2016 2017
All Opioids plus Stimulant Overdose Deaths by Race and Sex, 2013-2017 96 96 100 93 91 88 90 80 70 65 65 62 59 60 55 Percent White Percent Male 50 40 30 20 10 0 2013 2014 2015 2016 2017
Opioid plus Stimulant Deaths by Age Distribution, 2013-2017 60 50 Number of Deaths 40 2013 2014 2015 2016 2017 30 20 10 0 5-14 years 15-24 years 25-34 years 35-44 years 45-54 years 55-64 years 65-74 years 75-84 years 85+ years
Opioid plus Stimulant Deaths by Age Distribution, 2013-2017 60 50 15-24 years 25-34 years 35-44 years 45-54 years 55-64 years 65-74 years 75-84 years 85+ years 40 Number of Deaths 30 20 10 0 2013 2014 2015 2016 2017
All Drug Death Rates by Age Distribution, 2013-2017 60 50 40 Rate of Deaths 2013 2014 2015 2016 2017 30 20 10 0 <1 year 1-4 years 5-14 years 15-24 years25-34 years35-44 years45-54 years55-64 years65-74 years75-84 years 85+ years Rate is per 100,000 persons.
All Drug Death Rates by Age Distribution, 2013-2017 60 50 15-24 years 25-34 years 35-44 years 45-54 years 55-64 years 65-74 years 75-84 years 85+ years 40 Rate of Deaths 30 20 10 0 2013 2014 2015 2016 2017 Rate is per 100,000 persons.
All Opioid Death Rates by Age Distribution, 2013-2017 40 35 30 Rate of Deaths 25 2013 2014 2015 2016 2017 20 15 10 5 0 5-14 years 15-24 years 25-34 years 35-44 years 45-54 years 55-64 years 65-74 years 75-84 years 85+ years Rate is per 100,000 persons.
All Opioid Death Rates by Age Distribution, 2013-2017 40 35 30 15-24 years 25-34 years 35-44 years 45-54 years 55-64 years 65-74 years 75-84 years 85+ years 25 Rate of Deaths 20 15 10 5 0 2013 2014 2015 2016 2017 Rate is per 100,000 persons.
Pain Reliever Death Rates by Age Distribution, 2013-2017 30 25 20 Rate of Deaths 2013 2014 2015 2016 2017 15 10 5 0 5-14 years 15-24 years 25-34 years 35-44 years 45-54 years 55-64 years 65-74 years 75-84 years 85+ years Rate is per 100,000 persons.
Pain Reliever Death Rates by Age Distribution, 2013-2017 30 25 15-24 years 25-34 years 35-44 years 45-54 years 55-64 years 65-74 years 75-84 years 85+ years 20 Rate of Deaths 15 10 5 0 2013 2014 2015 2016 2017 Rate is per 100,000 persons.
All Heroin Death Rates by Age Distribution, 2013-2017 12 10 8 Rate of Deaths 2013 2014 2015 2016 2017 6 4 2 0 5-14 years 15-24 years 25-34 years 35-44 years 45-54 years 55-64 years 65-74 years 75-84 years 85+ years Rate is per 100,000 persons.
All Heroin Death Rates by Age Distribution, 2013-2017 12 10 15-24 years 25-34 years 35-44 years 45-54 years 55-64 years 65-74 years 75-84 years 85+ years 8 Rate of Deaths 6 4 2 0 2013 2014 2015 2016 2017 Rate is per 100,000 persons.
All Fentanyl Death Rates by Age Distribution, 2013-2017 20 18 16 14 Rate of Deaths 12 2013 2014 2015 2016 2017 10 8 6 4 2 0 5-14 years 15-24 years 25-34 years 35-44 years 45-54 years 55-64 years 65-74 years 75-84 years 85+ years Rate is per 100,000 persons.
All Fentanyl Death Rates by Age Distribution, 2013-2017 20 18 16 15-24 years 25-34 years 35-44 years 45-54 years 55-64 years 65-74 years 75-84 years 85+ years 14 12 Rate of Deaths 10 8 6 4 2 0 2013 2014 2015 2016 2017 Rate is per 100,000 persons.


")