Dynamic Tabular View and Chart Selection in Data Visualization
Enhance data visualization by dynamically displaying global, regional, and country-specific data in tabular view and charts based on user selection. Eliminate redundant dropdowns for a streamlined user experience. Our flat-file data structure ensures accurate representation at all levels.

Download Presentation

Please find below an Image/Link to download the presentation.
The content on the website is provided AS IS for your information and personal use only. It may not be sold, licensed, or shared on other websites without obtaining consent from the author. If you encounter any issues during the download, it is possible that the publisher has removed the file from their server.
You are allowed to download the files provided on this website for personal or commercial use, subject to the condition that they are used lawfully. All files are the property of their respective owners.
The content on the website is provided AS IS for your information and personal use only. It may not be sold, licensed, or shared on other websites without obtaining consent from the author.
E N D
Presentation Transcript
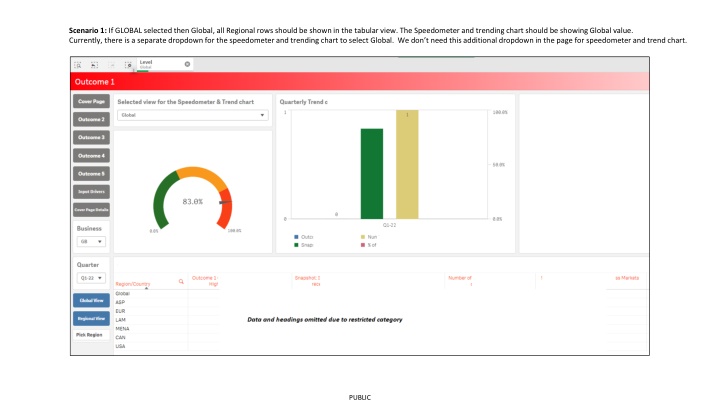
Scenario 1: If GLOBAL selected then Global, all Regional rows should be shown in the tabular view. The Speedometer and trending chart should be showing Global value. Currently, there is a separate dropdown for the speedometer and trending chart to select Global. We don t need this additional dropdown in the page for speedometer and trend chart. PUBLIC
Scenario 2: IF REGIONAL selected then Global, selected Region and Countries within selected Region should be shown in the tabular view. The Speedometer and trending chart should be showing value of selected region Currently, there is a separate dropdown for the speedometer and trending chart to select one Region. We don t need this additional dropdown in the page for speedometer and trend chart. PUBLIC
Scenario 3: IF COUNTRY selected then Global, Region of selected Country, and selected Country (e.g. Germany is selected, then Global, Europe, Germany) should be shown in the tabular view. The speedometer and trending chart should be showing values of selected country i.e.: Germany Currently, there is a separate dropdown for the speedometer and trending chart to select any one Country. We don t need this additional dropdown in the page for speedometer and trend chart. PUBLIC
Our data is a flat file, where global, regions could have their own value and doesnt add/roll up with the value of regions and countries respectively. PUBLIC