Ecological Dynamics and Hybridization: Deciphering Species Interactions
The content delves into various ecological and evolutionary topics, from understanding interspecific aggression to the dynamics of hybridization. It includes feedback on course evaluations, details on upcoming seminars, and graphical representations illustrating predator-prey interactions and species coexistence. The discussions cover isoclines, population growth equations for sharks and remoras, and the potential for coexistence between these species. Dive into a world of ecological intricacies and evolutionary dynamics with this informative content.
Download Presentation

Please find below an Image/Link to download the presentation.
The content on the website is provided AS IS for your information and personal use only. It may not be sold, licensed, or shared on other websites without obtaining consent from the author.If you encounter any issues during the download, it is possible that the publisher has removed the file from their server.
You are allowed to download the files provided on this website for personal or commercial use, subject to the condition that they are used lawfully. All files are the property of their respective owners.
The content on the website is provided AS IS for your information and personal use only. It may not be sold, licensed, or shared on other websites without obtaining consent from the author.
E N D
Presentation Transcript
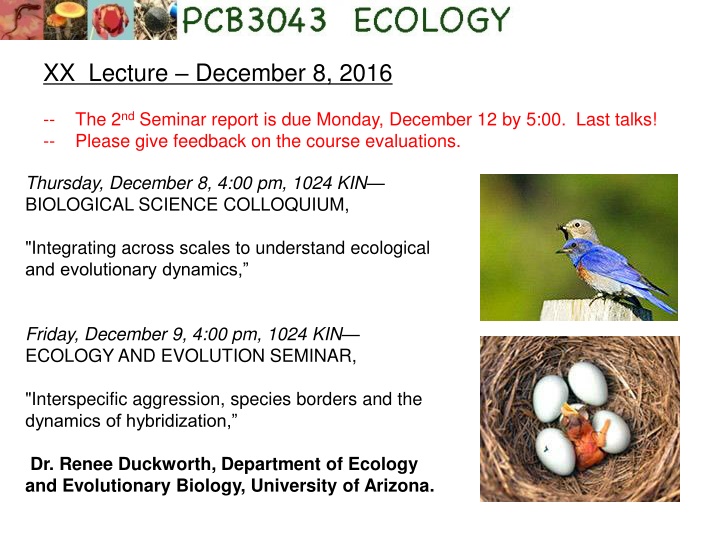
XX Lecture December 8, 2016 -- The 2nd Seminar report is due Monday, December 12 by 5:00. Last talks! -- Please give feedback on the course evaluations. Thursday, December 8, 4:00 pm, 1024 KIN BIOLOGICAL SCIENCE COLLOQUIUM, "Integrating across scales to understand ecological and evolutionary dynamics, Friday, December 9, 4:00 pm, 1024 KIN ECOLOGY AND EVOLUTION SEMINAR, "Interspecific aggression, species borders and the dynamics of hybridization, Dr. Renee Duckworth, Department of Ecology and Evolutionary Biology, University of Arizona.
OLD CURVE F D C B A 12 10 Frequency 8 6 4 2 0 150 200 60% 250 300 51% 73% 84% Total Points so far . . From 335 total points with lowest quiz dropped!
NEW CURVE 0.747 10 F D C B A 8 Frequency 6 4 2 0 0.5 0.6 0.7 0.8 0.9 Percent From 380 total points with lowest quiz dropped.
120 K s = 60, red wins 80 RED FISH Draw a graph with the appropriate isoclines for this scenario, labeling each isocline. Put in arrows within the zones, showing why red always wins when in competition. 60 40 20 0 0 20 40 60 80 100 BLUE FISH 120 Fish now coexist at (35,45) because reds have less effect on blues. 80 RED FISH 60 Draw the isoclines expected under high predation. Label your isoclines . Again, draw arrows in each zone to explain why we now find coexisting fish. 40 20 0 0 20 40 60 80 100 BLUE FISH 120 Kblue increases. 80 RED FISH Now, draw the isoclines a third time, but with high predation on the redfish and improved food processing by the blue fish. Again, label your isoclines and draw arrows explaining the expected outcome of competition. 60 40 20 0 0 20 40 60 80 100 BLUE FISH
2. The figure on the left shows interactions between predator and prey through time, starting with 10 prey and 2 predators, until some equilibrium is reached. A. Draw appropriate isoclines in the graph on the left that are consistent with the pattern shown. B. Convert the information from the graph on the left to the graph on the right. 10 50 Number of predators or prey Number of Predators -- P 8 40 6 30 4 20 2 10 0 0 0 20 40 60 80 100 0 20 40 60 80 100 Number of Prey -- N Time
3. Consider remoras, these odd fish that must live on sharks. For this example, lets assume that all remoras must live on a shark, but they have negligible effects on the shark itself. A. Please create simple population growth equations for both the number of remoras (R)and the sharks (S). dR/dt = rr * R * (cSS R)/cSS dS/dt = rS or rS * S * (KS S)/KS B. Now, determine the equations and graphs that indicate if the remoras and sharks might coexist, using your above equations. set both equations to zero and solve for isocline: R = ScS S = KS
120 100 Number of Cuban Anoles 80 60 40 20 0 0 20 40 60 80 100 120 Number of Green Anoles
B. Now consider the native Green anoles if they are growing in our cages without Cuban anoles present. While they do have positive population growth when at very low abundances, they have problems finding each other for mating. The per-capita reproduction increases as their numbers get larger, and they reach their carrying capacity in about 80 weeks. Draw appropriate lines in the boxes below. 100 2.0 1.0 Population Growth of Green Anoles Percapita Growth of Green Anoles Numbers of Green Anoles 80 0.8 1.5 60 0.6 1.0 40 0.4 0.5 20 0.2 0 0.0 0.0 0 20 40 60 80 100 0 20 40 60 80 100 0 20 40 60 80 100 Weeks Weeks Density
5. Kneitel and Miller studied the food web found in the water-filled leaves of the purple pitcher plant. Answer the following questions based on their experiment and the graph on the right. 1. Which of Paine s three types of food webs was shown and discussed in the paper? Explain how you know connectedness, energy flow, or functional 2. Which definition of the niche (role or needs of a species) was being evaluated in these experiments? Explain. 3. The experiment used 5 replicate leaves per treatment and the results above show the average species richness per leaf. Is this alpha, beta, or gamma richness? Explain.
4. In later experiments, Miller sent undergraduates out in the field every two days with pipettes to move liquid around among leaves, essentially creating corridors like Gilbert s study of moss organisms. Based on Gilbert s results, what would you expect to happen to pitcher plant richness with and without dispersal? Create a bar graph showing us your expected results. 5. These pitcher plants have mosquitoes that act as keystone predators. So, now draw a graph that shows the same results as above, but with and without the effects of a keystone predator. So, we want four bars for all combinations of with and without mosquitoes and with and without dispersal.
