Economic and Fiscal Impacts of Devon Energy in Barnett Shale of North Texas
Explore the economic and property income impacts of Devon Energy operations in the Barnett Shale of North Texas. Analyze figures and data related to oil and gas property tax values, minerals in school district tax base, and overall economic activity supported by Devon's operations. Understand the significance of these impacts on local communities and the wider Texas economy.

Download Presentation

Please find below an Image/Link to download the presentation.
The content on the website is provided AS IS for your information and personal use only. It may not be sold, licensed, or shared on other websites without obtaining consent from the author. If you encounter any issues during the download, it is possible that the publisher has removed the file from their server.
You are allowed to download the files provided on this website for personal or commercial use, subject to the condition that they are used lawfully. All files are the property of their respective owners.
The content on the website is provided AS IS for your information and personal use only. It may not be sold, licensed, or shared on other websites without obtaining consent from the author.
E N D
Presentation Transcript
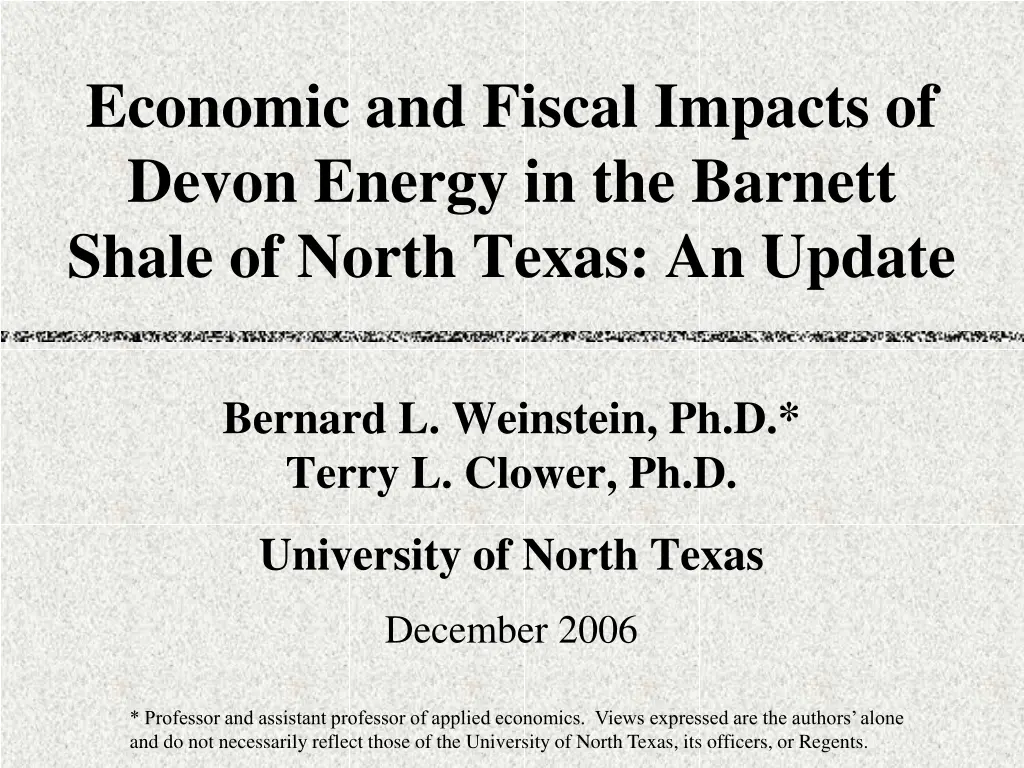
Economic and Fiscal Impacts of Devon Energy in the Barnett Shale of North Texas: An Update Bernard L. Weinstein, Ph.D.* Terry L. Clower, Ph.D. University of North Texas December 2006 * Professor and assistant professor of applied economics. Views expressed are the authors alone and do not necessarily reflect those of the University of North Texas, its officers, or Regents.
Oil and Gas Property Tax Values % Change 2000-2005 5602% 60373% 913% 217533% 369% 141% County Denton Tarrant Wise Johnson Parker Palo Pinto Erath Hood Hill Total 2000 2005 $48,200,100 $1,226,703 $196,502,840 $66,932 $29,004,240 $51,693,210 $9,549,790 $4,534,040 $27,175 $340,805,030 $2,748,406,110 $741,825,050 $1,991,325,370 $145,666,190 $135,907,200 $124,568,510 $15,326,210 $7,540,760 $11,360 $5,910,576,760 60% 66% -58% 1634% Source: Texas Comptroller of Public Accounts
Oil, Gas, and Minerals in School District Tax Base, 2005 County Total OGM % OGM Denton ISD (Denton Co.) $7,280,054,652 $37,189,184 0.5108% Northwest ISD (Denton Co.) $7,456,681,553 $1,704,160,200 22.8541% Bridgeport ISD (Wise Co.) $955,564,830 $77,215,860 8.0807% Decatur ISD (Wise Co.) $1,355,073,370 $476,976,620 35.1993% Source: Texas Comptroller of Public Accounts
Economic and Property Income Impacts of Devon Operations: Nine County Barnett Shale Operating Area 2005 Total Impacts Exploration, Drilling, Production Activities and Property Income Expenditures Total Economic Activity Supported Total Labor Income Total Employment (jobs) Indirect Property Income from All Activities* * Includes indirect and induced property income impacts to rents, royalties, dividends, and corporate profits. Study area includes Denton, Erath, Hill, Hood, Johnson, Palo Pinto, Parker, Tarrant, and Wise counties. $ 833,850,000 $ 1,363,412,000 $ 410,717,000 8,844 $ 98,161,000
Economic and Property Income Impacts of Devon Operations on the Overall Texas Economy, 2005 Total Impacts Exploration, Drilling, Production Activities and Property Income Expenditures Total Economic Activity Supported Total Labor Income Total Employment (jobs) Indirect Property Income from All Activities* $ 833,850,000 $ 1,703,460,000 $ 564,382,000 11,168 $ 149,809,000 * Includes indirect and induced property income impacts to rents, royalties, dividends, and corporate profits.
Economic and Property Income Impacts of Devon Operations, Barnett Shale Operating Area, 2006-2010 Description Impact Total Impacts Exploration, Drilling, Production Activities and Property Income Exploration and Production Expenditures Total Economic Activity Supported Total Labor Income Total Employment (average annual jobs) Indirect Property Income from All Activities* $ 9,470,000,000 $ 15,192,360,000 $ 4,584,498,000 19,644 $ 1,060,004,000 Estimates not adjusted for inflation. * Includes indirect and induced property income impacts to rents, royalties, dividends, and corporate profits. Study area includes Denton, Erath, Hill, Hood, Johnson, Palo Pinto, Parker, Tarrant, and Wise counties.
Employment Change Aug. 2000 Aug. 2006 % Change 2000-2006 County Dallas Denton Tarrant Wise Johnson Parker Palo Pinto Erath Hood Hill DFW MSA Aug. 2000 1,140,046 259,820 763,435 24,368 63,719 44,523 12,758 15,509 19,302 14,581 2,744,263 Aug. 2006 1,154,840 308,605 828,910 27,223 70,962 49,754 13,986 16,751 21,857 14,659 2,978,473 1.3% 18.8% 8.6% 11.7% 11.4% 11.7% 9.6% 8.0% 13.2% 0.5% 8.5% Source: Texas Workforce Commission
Change in Personal Income 1990-2004 % Change 1990-2000 89.9% 179.0% 90.9% 116.7% 111.9% 143.7% 70.4% 68.5% 155.1% 85.4% 111.0% % Change 2000-2004 10.3% 20.7% 17.9% 23.2% 20.7% 16.7% 13.0% 16.9% 15.1% 19.9% 14.6% County Dallas Denton Tarrant Wise Johnson Parker Palo Pinto Erath Hood Hill DFW MSA 1990 2000 2004 $42,235,901 $5,199,622 $23,080,004 $496,504 $1,457,601 $1,045,787 $343,645 $435,869 $450,733 $351,785 $83,682,643 $176,530,068 $202,219,327 $80,217,322 $14,506,927 $44,068,188 $1,076,166 $3,088,334 $2,548,899 $585,523 $734,255 $1,149,864 $652,168 $88,450,084 $17,511,626 $51,951,087 $1,325,300 $3,728,541 $2,974,960 $661,747 $858,073 $1,323,387 $781,813 Source: Bureau of Economic Analysis
Population Projections 2005-2030 % Change 2005-2030 42.4% 94.3% 38.5% 56.1% 54.4% 45.6% 22.7% 28.3% 46.0% 32.9% 52.5% County Dallas Denton Tarrant Wise Johnson Parker Palo Pinto Erath Hood Hill DFW MSA 2005 2010 2015 2020 2025 2030 2,388,186 2,565,713 2,749,375 2,945,410 3,162,134 3,400,638 515,897 603,269 696,266 1,553,806 1,662,906 1,777,265 1,895,743 2,021,029 2,152,759 53,186 59,302 65,162 138,806 152,216 166,809 96,555 105,249 114,401 28,132 29,401 30,800 35,790 38,083 40,162 44,641 48,429 52,580 34,293 36,565 38,938 5,668,679 6,197,537 6,751,742 7,338,736 7,971,664 8,646,776 793,227 895,478 1,002,361 71,166 182,200 123,633 32,128 42,245 56,908 41,271 77,182 198,069 132,396 33,367 44,146 61,136 43,479 83,010 214,250 140,592 34,511 45,924 65,190 45,591 Source: Texas State Data Center Note: All projections based on 0.5 Scenario
Employment Projections 2005-2030 % Change 2005-2030 42.8% 95.2% 38.7% 56.6% 61.6% 45.9% 21.4% 28.5% 46.2% 33.0% County Dallas Denton Tarrant Wise Johnson Parker Palo Pinto Erath Hood Hill 2005 2010 2015 2020 2025 2030 1,178,753 1,270,155 1,361,077 1,458,124 1,565,413 1,683,484 313,121 367,847 424,552 843,630 903,753 965,905 1,030,295 1,098,385 1,169,978 26,497 29,651 32,581 73,670 84,564 92,672 48,428 52,889 57,488 12,639 13,067 13,689 16,783 17,879 18,855 21,436 23,283 25,279 14,528 15,494 16,499 483,675 546,023 611,196 35,583 101,222 62,127 14,279 19,833 27,360 17,488 38,591 110,038 66,531 14,830 20,726 29,392 18,423 41,505 119,028 70,649 15,338 21,561 31,341 19,318 Sources: Texas State Data Center; U.S. Census Bureau; Bureau of Labor Statistics; The Real Estate Center at Texas A&M; and Authors Estimates
Conclusions Gas exploration and production is playing an important role in the North Texas economy. Devon s activities are generating almost 9,000 local jobs, creating economic activity, and boosting local tax revenues. As a result of increasing North American demand for clean-burning natural gas, Devon will continue to be a major contributor to the regional economy in the years ahead.