Economic Application and Modeling in Inkomati Catchment
Explore the economic application and modeling processes in the Inkomati Catchment, focusing on delineating units of analysis, stakeholder engagement, quantifying ecosystem services, identifying scenarios, drafting management classes, setting resource quality objectives, and evaluating economic parameters to understand the impact of water reduction.

Download Presentation

Please find below an Image/Link to download the presentation.
The content on the website is provided AS IS for your information and personal use only. It may not be sold, licensed, or shared on other websites without obtaining consent from the author. If you encounter any issues during the download, it is possible that the publisher has removed the file from their server.
You are allowed to download the files provided on this website for personal or commercial use, subject to the condition that they are used lawfully. All files are the property of their respective owners.
The content on the website is provided AS IS for your information and personal use only. It may not be sold, licensed, or shared on other websites without obtaining consent from the author.
E N D
Presentation Transcript
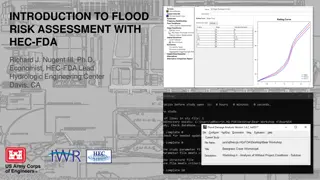
Economic Application for Scenarios in the Inkomati Catchment 26 February2014
Inkomati NWRCS steps 1: Delineate units of analysis and describe the status quo 2: Initiation of stakeholder process and catchment visioning 3: Quantify EWRs and changes in Ecosystem Services 4: Identification and evaluation of scenarios within IWRM 5: Draft Management Classes 6: Resource Quality Objectives (EcoSpecs & water quality (user)) 7: Gazette class configuration Economics: Where does it fit in? 2
Socio-Economic Approach It is important to keep in mind that the classification process process. The contribution of the socio-economic sector is divided into two groups The Ecosystem Services which deals with the value of the water left in the river. The Economic Activities which deals with the value of the water removed from the river. is an integrated
Modeling of Primary Sector in WIM-model Future inputs Main Drivers: (Water Volume; Hectares) Specific Crop Production Budgets (Income and Costs) Inputs: Example - Irrigation Agriculture Income distributed to economic sectors taken up in the economy(Agriculture, Mining, Manufacturing, Electricity, Water, Construction, Trade and Accommodation, Transport and Communication, Financial and Business Services) Economic Water Modelling Multipliers used from derived from Social Accounting Matrix Direct, Indirect and Induced impacts: GDP Employment Household Income Future outputs Output: Results 4
Economics Parameters To Use Macro-economic indicators to determine the impact in the reduction of water. Changes in GDP Changes in Employment Changes in income distribution Cost indicators of construction of raising of dam wall, pipeline and canal costs. External costs from economic sectors will also be evaluated if the sector affects the scenario, i.e. Acid Mine Water Drainage
Economic Indicators Why the specific indicator? Show Economic Growth Poverty Alleviation Contributors Gross Domestic Product (GDP) The impact on GDP reflects the magnitude of the values added to the regional and wider economy from activities using the water. Value added is made up of three elements, namely: Remuneration of employees (payments to households), Gross operating surplus (which includes profit and depreciation), and Net indirect taxes.
Economic Indicators Employment Labour is a key element of the production process. The study estimate the number of employment opportunities currently supported by the use of the water. These employment opportunities is broken down into those created directly by each of the economic sectors sector and those created indirectly and those induced throughout the broader economy Payments to households One of the elements of the value added (i.e. GDP) which results from the sector where water is allocated is the remuneration of employees, which, in turn, affects households income. Econometric models measures the magnitude of changes that occur to both household income and the spending/savings pattern. As such, the results highlight the impact of water use on the low-income households as this can be used as an indicator of the extent to which the water availability contributes to poverty alleviation throughout the economy. 7