Economic assessment of global OC constellation benefits
Analyzing the economic value of the OCR-VC to various sectors including climate change, carbon economy, and ecosystem services in coastal and inland regions. Discusses the feasibility and target audience for producing a quantified statement on the economic value of OCR.

Download Presentation

Please find below an Image/Link to download the presentation.
The content on the website is provided AS IS for your information and personal use only. It may not be sold, licensed, or shared on other websites without obtaining consent from the author.If you encounter any issues during the download, it is possible that the publisher has removed the file from their server.
You are allowed to download the files provided on this website for personal or commercial use, subject to the condition that they are used lawfully. All files are the property of their respective owners.
The content on the website is provided AS IS for your information and personal use only. It may not be sold, licensed, or shared on other websites without obtaining consent from the author.
E N D
Presentation Transcript
Should IOCCG perform an economic value assessment of global OC constellation? What interest/value do we see in making an economically quantified science benefit statement on the OCR-VC? Who would we be aiming it at? Would it be doable/viable to produce some fairly short piece estimating the global economic value of OCR across the oceanic/climate change/carbon economy through to ecosystem services in the coastal and inland domains? Publishable in e.g Environmental Science & Policy or Space Policy? Useful, marginal, or fairground barker snake oil?
.The state of the art in understanding the VOI reflects general agreement on how to model an individual s or a government s decision and some useful implications about the value of information: when it is most and least valuable, its relationship to subjective prior opinions, and the decision maker s ability to take action in light of the information. The VOI can be nil if, say, a decision maker cannot take action even if good information is available. The VOI can be quite large if the decision maker can take action saving lives, increasing productivity, and so forth ..
EO & Service Value Study Examples Europe GMES (2011). Cost-Benefit Analysis for GMES , European Commission: Directorate-General for Enterprise & Industry, September 2011 http://copernicus.eu/pages-principales/library/study-reports/ Socio-Economic Benefits from the Use of Earth Observation Report from the International Workshop held at Joint Research Centre, Ispra. 11-13 July 2011. M. T. Borzacchiello and M. Craglia Institute for Environment and Sustainability USA Adams, Rich,Martin Brown, Charlie Colgan, Nic Flemming, Hauke Kite-Powell, Bruce McCarl,Jim Mjelde, Andy Solow, Tom Teisberg, Rodney Weiher. The Economics of Sustained Ocean Observations: Benefits and Rationale for Public Funding , A Joint Publication of National Oceanic and Atmospheric Administration and the Office of Naval Research, August 2000 http://www.publicaffairs.noaa.gov/worldsummit/pdfs/isoos.pdf WHOI-2005-3. (2005) Estimating the Economic Benefits of Regional Ocean Observing Systems, Woods Hole Oceanog. Inst. Tech. Rept, WHOI-2005-03. Landsat economic value study 2015 India NCAER (2010) "Impact Assessment and Economic Benefits of Weather and Marine Services", National Council of Applied Economic Research (NCAER), New Delhi, India.http://www.ncaer.org/popuppages/PublicationDetails.aspx?ReferenceID=SE100004 Australia ATSE (2006). The Economics of Australia s Sustained Ocean Observation System, Benefits and Rationale for Public Funding, Report for the Australian Academy of Technological Sciences and Engineering and the Western Australian Global Ocean Observing System Inc.. August 2006. CRC-SI, 2010. The economic value of earth observation from space. A review of the value to Australia of Earth observation from space. Prepared for the Cooperative Research Centre for Spatial Information (CRC-SI) and Geoscience Australia
Application & Domain Value Study Examples Noone et al 2012: Valuing the Ocean
The Bigger Picture: The Economic Costs of Declining Water Quality In freshwater systems, potential total eutrophication-related losses in the United States are estimated at up to US$4.6 billion annually (Dodds et al, 2009). The 1998 season of cyanobacterial blooms in the Lake Tai catchment (China) resulted in estimated economic losses of US$6.5 billion (Le et al., 2010); annual costs of freshwater algal blooms in Australia were estimated at A$200 million in 2000 (Atech, 2000), with similar annual eutrophication costs in the United Kingdom estimated at US$150 million (Pretty et al., 2003) and in South Africa at US$250 million (Frost and Sullivan, 2010). Global economic losses due to pollution, eutrophication and declining water quality have been estimated at US$6 - 10 billion (OECD 2012) Taking a typical Value of Information estimate of maximum 1% (Macauley, 2006) of the value of the resource in this case eutrophication related economic loss, a global Water Quality observation system could be valued at up to US$50 - 100 million pa .
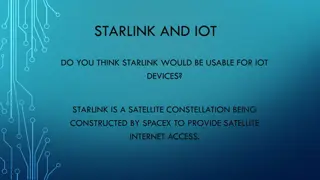
BENEFITS OF IMPROVED OCEAN-ATMOSPHERE PREDICTABILITY Millenium Century Decade Month Year Day Fig. 3: In the early days of GOOS planning Dana Kester made this presentation of the timescale of different kinds of predictability, and the activities and services which would benefit. (Adapted from Dana Kester 1993). Each activity is linked to a timescale of prediction which is most relevant to it in terms of needs and benefits. Inter- Annual Outlook 3-Day Forecast Seasonal Projectn Climate Change 0 1 2 3 4 5 6 Log10 (Time in Days) CO2 emissions policy Climate prediction Energy forecasts Coastal protection Facilities planning Agricultural projections Fisheries utilisation Energy management Transportation planning Land management Safety warnings and hazard prevention Fishing operations Ship routeing Offshore oil and gas operations Search and rescue Environmental protection Defence
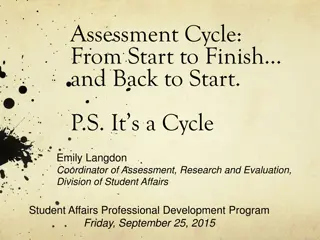
Climate Change Basin Scale Ecosystem Services Carbon Economy Ocean Ecology & Diversity Fisheries Support & Management Aquaculture Water Quality & Eutrophication 100m Operational Services Decades Near Real TIme
IOCCG Report Number 7, 2008 Why Ocean Colour? The Societal Benefits of Ocean- Colour Technology 3 Ocean-Colour Data - An Aid to Modelling 4 Ocean-Colour Radiometry and Ocean Physics 5 Biogeochemical Cycles 6 Ocean-Colour Radiometry and Fisheries 7 Ocean-Colour Radiometry and Water Quality 8 A Window on the State of the Marine Ecosystem 9 Hazards: Natural and Man-Made 10 Ocean Colour and Climate Change
Should IOCCG perform an economic value assessment of global OC constellation? Perhaps possible to use mixture of approaches: 1) Showcase application range through short regional case studies with global scaling and VOI economics based on actionable data e.g. 1% of a change/damage/impact figure 2) Use global carbon and ecosystem service figures and apply some range of VOI figures Applications-grounded approach allows combination of traditional OCR showcasing with some value numbers attached, the economic arguments are log-scale, not precision i.e. primary intent is to show value order of magnitude > than mission costs .