Economic Consequences of Slower Population Growth and Aging
The economic implications of slower population growth and faster aging are examined in the context of the Great Demographic Reversal. The demographic transition, shifts in age distribution, and their impact on global GDP and labor income are discussed. Insights from the study by Ronald Lee at UC Berkeley provide valuable perspectives on the challenges posed by demographic changes.

Download Presentation

Please find below an Image/Link to download the presentation.
The content on the website is provided AS IS for your information and personal use only. It may not be sold, licensed, or shared on other websites without obtaining consent from the author.If you encounter any issues during the download, it is possible that the publisher has removed the file from their server.
You are allowed to download the files provided on this website for personal or commercial use, subject to the condition that they are used lawfully. All files are the property of their respective owners.
The content on the website is provided AS IS for your information and personal use only. It may not be sold, licensed, or shared on other websites without obtaining consent from the author.
E N D
Presentation Transcript
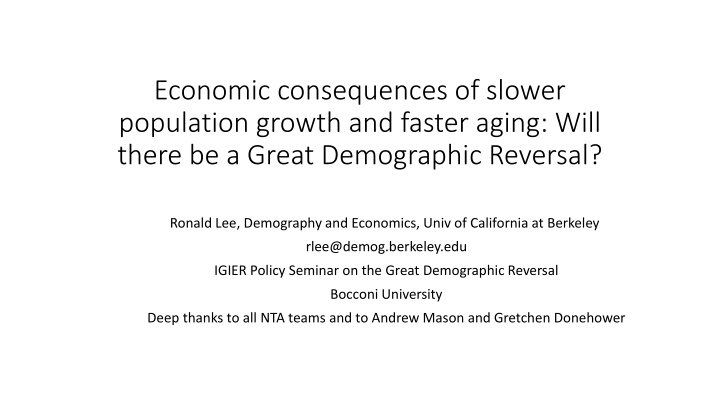
Economic consequences of slower population growth and faster aging: Will there be a Great Demographic Reversal? Ronald Lee, Demography and Economics, Univ of California at Berkeley rlee@demog.berkeley.edu IGIER Policy Seminar on the Great Demographic Reversal Bocconi University Deep thanks to all NTA teams and to Andrew Mason and Gretchen Donehower
Not a critique of Great Reversal, but rather looking at some similar issues from different perspective. I will say nothing about inflation I focus on fundamentals and direct consequences of demographic change. Ron Lee, UC Berkeley, April 2021 2
1. The demographic transition in a population unfolds over a couple of centuries Ron Lee, UC Berkeley, April 2021 3
A population moves from many births and short life to low fertility and long life. These changes bring changes in the population age distribution, the shares in the pop of children, working ages, and the elderly. In mid transition, the share in working ages rises boosting the growth rate of per capita income: the demographic dividend . Later in the transition, the share of elderly rises reducing the growth rate of per capita income and stressing societal support systems: costs of population aging. Ron Lee, UC Berkeley, April 2021 4
A typical demographic Transition: Costa Rica, Costa Rica, 1950-2100. Old Age Dep Ratio Youth Dep Ratio Ron Lee, UC Berkeley, April 2021 5
2. What are the economic consequences of these changes? First, global GDP. Use age profiles from National Transfer Accounts. Labor inc = wages and salaries + 2/3*self employment inc Averaged across males, females, and zeros Consumption = household cons imputed to individuals + in-kind govt transfers like public education, public health care, long term care. Ron Lee, UC Berkeley, April 2021 6
Average per capita labour income by age for countries by income group (expressed for each country as ratio to average labour income ages 30-49, 160 countries) Source: Figure 1 in United Nations Department of Economic and Social Affairs Population Division, Technical Paper No. 2017/1 Support Ratios and Demographic Dividends: Estimates for the World Ron Lee, UC Berkeley, April 2021 7
Use these to find effect of population on global GDP 1. Calculate effective labor in ppp adjusted monetary units for each of 186 countries Multiply pop age distribution times NTA labor income age profile and sum. Do for past, present and future UN pop data. Gives total labor income in each year if only demography varies 2. Add these up across all countries to get global labor income estimate net of productivity growth. Just demography. Reflects demographic change in each country Reflects productivity differences across countries. 3. Assume labor income is fixed share of GDP (not quite true). Ron Lee, UC Berkeley, April 2021 8
From Maddison, World Bank etc. Then our projection. Ron Lee, UC Berkeley, April 2021 9
Era of population driven global GDP growth is over! Why does growth rate of global labor supply drop so low (to .15%/y)? Rapid labor growth is occurring in Sub-Saharan Africa, but productivity is very low so it has little impact on global GDP growth. Slow or negative labor growth is occurring in high productivity countries (Europe, N. America, E. Asia, etc.) with big impact on GDP growth. Share of population in driving GDP growth drops from more than half in 1975-2000 to less than a tenth in 2020-2060. Ron Lee, UC Berkeley, April 2021 12
Per capita GDP growth will be much less affected. Relative to 1975-2000 it will grow .4%/y faster in 2020-2060. Ron Lee, UC Berkeley, April 2021 14
3. Most worries about pop aging are due not to the production side, but to redistribution Age profile of labor income very different than profile of consumption. Children and elderly consume much more than they produce. Assets and asset income helps support the elderly, but In most countries, public transfers fill most of the gap Public pensions Public health care Public long term care For children, public education and public health care are most impt. Ron Lee, UC Berkeley, April 2021 15
Average per capita consumption by age for countries by income group (expressed for each country as ratio to average labour income ages 30-49, 160 countries) Per capita consumption by age, for income groups. Includes both private household cons and in-kind public transfers (health, education) Source: Figure 2 in United Nations Department of Economic and Social Affairs Population Division, Technical Paper No. 2017/1 Support Ratios and Demographic Dividends: Estimates for the World Ron Lee, UC Berkeley, April 2021 16
Why is this a concern? When a population ages there are more elderly consuming more than they produce, and fewer workers producing more than they consume. Something has to give either workers make bigger transfers (e.g. with higher taxes) or elderly receive smaller benefits (e.g. lower pension or later retirement). This is the main concern with population aging. Ron Lee, UC Berkeley, April 2021 20
Support ratio is simplest approach, reflecting dependency Calculate ratio of available workers to needed consumption. Assume NTA labor income describes available labor at each age, in efficiency units NTA consumption describes consumption needs at each age. productivity growth raises both age profiles over time in same way, so their ratios are unchanging. Now calculate support ratios over time. Ron Lee, UC Berkeley, April 2021 21
Support Ratio = ratio of Potential workers to potential consumers Decrease = -.4%/yr Pop aging Increase = .7%/yr first dividend Contrast = 1.1% Based on UN pop data and forecasts, and estimated consumption and labor income age profiles for Costa Rica by Costa Rican country team, led by Luis Rosero-Bixby. Ron Lee, UC Berkeley, April 2021 22
General shape of transition trajectory is standard. Position of some pops on demog transition today. China India Details differ across countries because of: Hi Inc Niger *Rapidity and depth of fertility decline *Baby booms and busts superimposed. Based on UN pop data and forecasts, and estimated consumption and labor income age profiles for Costa Rica by Costa Rican country team, led by Luis Rosero-Bixby. Ron Lee, UC Berkeley, April 2021 23
A Great Demographic Reversal -- Support ratio in China Rises from 1971 to 2013. Falls fast after 2013. Av 1981-90 rises at 1.36%/y Av 1920-29 fall at 1.11 Diff is about 2.5%/y in growth of income per equiv consumer A huge economic shock. Dividend is rate of change of supp ratio Ron Lee, UC Berkeley, April 2021 24
Low-Mid Inc Support Ratio Great Reversal? Maybe. Less clear. Low-Inc High Inc Up-Mid Inc On global scale, supp ratio stops rising around now. Demog Div = change in Supp Rat Up-Mid Inc But Hi Inc countries have been aging for awhile. Low-Inc Low-Mid Inc Low Inc and Lower Mid Inc countries still in dividend phase. High Inc Ron Lee, UC Berkeley, April 2021 25
7. Taking capital into account Ron Lee, UC Berkeley, April 2021 26
Support ratio and Demographic Dividend are widely used concepts and measures But not all income comes from labor; a third comes from capital. Working age folks bring labor to the economy. Elderly in most countries bring capital to the economy. Asset (capital income) can pay for their old age consumption so they are not dependent on workers. More capital raises the productivity and wages of workers (if invested domestically). Ron Lee, UC Berkeley, April 2021 27
How does pop age distrib affect amount of capital? Asset holdings by age are accumulated through saving, but also by inheritance, taxation, and changing relative asset prices (e.g. housing market, stock prices). All these are reflected in NTA asset age profiles. Because elderly have accumulated the most capital, population aging increases the amount of capital relative to labor (if normal life cycle patterns continue). Ron Lee, UC Berkeley, April 2021 28
Example for US: standardized asset income from 1981-2011 Assets held mainly by elderly, 60+ Ron Lee, UC Berkeley, April 2021 29
For closed economy, simulated ratios of capital to labor (K/L) and also Wage to Interest Rate (w/r) relative to 2015 = 1.0 for both based on NTA data, assuming Cobb-Douglas production function. Asia Latin America Europe & US Brazil Philippines, India, Thailand Chile, Costa Rica Germany, US Mexico, Uruguay Sweden, Austria, Italy Japan, Indonesiab When pop aging raises capital more than labor, the capital intensity of economy rises. Labor productivity and wages rise, interest rate falls. Countries with biggest increases in K/L are earlier in demographic transition. Ron Lee, UC Berkeley, April 2021 30
From preceding I expect Rising real wages (more capital per worker) Higher productivity (more capital per worker) and probably increased international capital flows Lower interest rates (less labor per capital) Above should reduce income inequality. Ron Lee, UC Berkeley, April 2021 31
8. Discussion/Conclusions China reached a real demographic Reversal (in 2013 for Support Ratio) slowing growth of GDP and income per consumer in China. Rest of world s population is mix low inc countries benefit from demographic dividends high inc countries see costs of continuing population aging. Relative to 1975-2000, future population change slows global GDP growth by 1.6%/y. But per capita GDP will grow somewhat more rapidly. Interest rates will continue to fall as more elderly bring more assets. Real wages will rise due to more capital per worker in addition to technological progress. Higher real wages and lower returns to capital should reduce income inequality. Ron Lee, UC Berkeley, April 2021 32
END Ron Lee, UC Berkeley, April 2021 33