Economic Feasibility Analysis for Market Expansion
Evaluate market size, estimate volume, calculate production costs, conduct pricing analysis, and target consumers effectively for successful market expansion strategies. Understand the essentials of economic feasibility to maximize growth potential and profitability.

Download Presentation

Please find below an Image/Link to download the presentation.
The content on the website is provided AS IS for your information and personal use only. It may not be sold, licensed, or shared on other websites without obtaining consent from the author.If you encounter any issues during the download, it is possible that the publisher has removed the file from their server.
You are allowed to download the files provided on this website for personal or commercial use, subject to the condition that they are used lawfully. All files are the property of their respective owners.
The content on the website is provided AS IS for your information and personal use only. It may not be sold, licensed, or shared on other websites without obtaining consent from the author.
E N D
Presentation Transcript
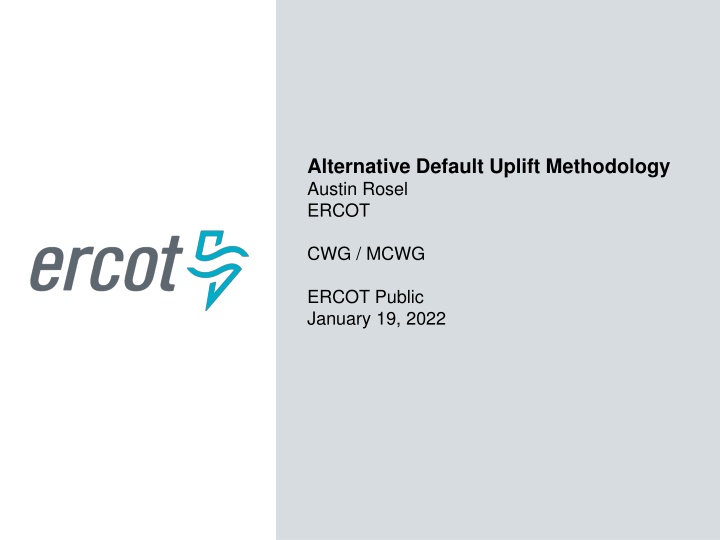
Alternative Default Uplift Methodology Austin Rosel ERCOT CWG / MCWG ERCOT Public January 19, 2022
Request for Data CWG / MCWG requested ERCOT bring some data to show what the default uplift allocation methodology would look like under a method similar to the one used by PJM. 2 ERCOT Public
Request for analysis on Default Uplift Allocation based on PJM methodology ERCOT Method Based on MWh activity ratio share. Based on month activity before the default occurred. Allocated to participants under a Counter-Party that contributed the maximum MWh of activity. PJM Method Based on an absolute dollar ratio share from monthly bills. Based on three months activity; month of default and previous two months. Allocated to all participants, even participants that did not have a monthly bill. PJM Methodology: https://agreements.pjm.com/oa/4616 3 ERCOT Public
PJM Allocation Formula (Amount of Default) * (0.1(1/N) + 0.9(A/Z)) N = Total number of members as of default date A = Absolute value of charges and credits from the monthly bill for a member. Z = Sum of A for all members comprising N. 0.1(1/N) is capped at $10,000 per member per year. If the amount is over $10,000 for a member, the excess is recovered in the 0.9(A/Z). 4 ERCOT Public
ERCOT adjustments to PJM methodology for estimates. No allocation based on number of participants Removed after discussion for implementation simplification. ERCOT does not stop QSEs/CRRAHs in systems on precise end dates. Allocation after $10,000 cap is based on $ ratio share. Removing the need to track a $10,000 cap per Participant reduces system cost. 5 ERCOT Public
ERCOT adjustments to PJM methodology for estimates. Daily settlement statement charge types and CRR Auction Invoices were used ERCOT invoices on a daily basis. Absolute value of daily settlement charges/credits reflected in statements were included. Absolute value of the total CRR Auction Invoices were included. Monthly settlements (CARD, CRRBA, ERS) were excluded (with the exception of CRR Auction Invoices). Charge types that are invoiced in one-off Miscellaneous Invoices were excluded. Used 3 months of activity like PJM method, ERCOT currently uses one month activity. 6 ERCOT Public
Current ERCOT Allocation Method January 2021 Counter-Party vs. QSE/CRRAH segments The chart on the left was previously presented and classifies default uplift amounts per segment at a Counter-Party Level for the reference month of January 2021 under the current ERCOT methodology. QSE/CRRAH underneath the Counter-Party are the ones that are actually charged the default uplift amounts. The chart on the right shows the segment totals at a QSE/CRRAH level. Counter-Party Level* January MMA Total QSE/CRRAH Level January MMA (MWh) January MMARS % January MMA Total (MWh) January MMA (MWh) January MMARS % Segment (MWh) Segment Gen 5,111,155.62 2.34% Gen 4,998,318.29 2.29% Load Load and Gen 11,775,576.00 5.39% Load Load and Gen 28,785,812.00 13.17% 218,577,111.29 94,398,323.87 43.19% 218,577,111.29 19,844,419.05 9.08% Trader CRRAH Only 99,998,094.20 45.75% Trader CRRAH Only 54,240,444.34 24.82% 7,293,961.60 3.34% 110,708,117.60 50.65% Total 218,577,111.29 100.00% Total 218,577,111.29 100.00% * Presented to CWG/MCWG in April 2021; updated to classify inactive Counter-Parties. 7 ERCOT Public
PJM Method January 2021 The following charts show the allocation per segment in the same manner as the previous slide but instead are calculated using the PJM methodology for the reference month of January 2021 only. QSE/CRRAH Level Counter-Party Level Total Charges and Credits ($) Abs of Charges and Credits ($) Total Charges and Credits ($) Abs of Charges and Credits ($) Segment Ratio Share Segment Ratio Share Gen 53,471,250.62 3.57% Gen 187,529,320.43 12.53% Load 87,143,599.79 5.82% Load 189,353,817.96 12.65% Load and Gen Load and Gen 1,496,363,922.22 1,496,363,922.22 1,120,881,237.36 74.91% 717,775,179.92 47.97% Trader 221,417,553.05 14.80% Trader CRRAH Only 242,624,783.77 16.21% CRRAH Only 13,450,281.40 0.90% 159,080,820.14 10.63% Total 1,496,363,922.22 100.00% Total 1,496,363,922.22 100.00% 8 ERCOT Public
PJM Method June through August 2021 Counter-Party Level Segment Gen Load Load and Gen Trader CRRAH Only Total Total Charges and Credits ($) Abs of Charges and Credits ($) Total Allocation of uplift ($) Ratio Share 356,957,087.64 540,182,952.27 7,679,978,512.90 1,085,422,795.30 46,859,921.62 9,709,401,269.73 91,910.17 139,087.61 1,977,459.35 279,477.27 12,065.61 2,500,000.00 3.68% 5.56% 79.10% 11.18% 0.48% 100.00% 9,709,401,269.73 QSE/CRRAH Level Segment Gen Load Load and Gen Trader CRRAH Only Total Total Charges and Credits ($) Abs of Charges and Credits ($) Total Allocation of uplift ($) Ratio Share 1,197,888,669.01 1,376,878,339.93 5,127,370,307.51 1,483,757,044.62 523,506,908.66 9,709,401,269.73 308,435.26 354,521.95 1,320,207.64 382,041.33 134,793.82 2,500,000.00 12.34% 14.18% 52.81% 15.28% 5.39% 100.00% 9,709,401,269.73 Total amount uplifted in this example is $2,500,000, which is the maximum monthly amount for ERCOT s current default uplift allocation. 9 ERCOT Public
PJM Method December 2019 through February 2020 Counter-Party Level Segment Gen Load Load and Gen Trader CRRAH Only Total Total Charges and Credits ($) Abs of Charges and Credits ($) Total Allocation of uplift ($) Ratio Share 168,878,081.99 250,386,357.82 3,281,269,236.42 680,268,809.19 44,510,433.48 4,425,312,918.90 95,404.60 141,451.22 1,853,693.34 384,305.48 25,145.36 2,500,000.00 3.82% 5.66% 74.15% 15.37% 1.01% 100.00% 4,425,312,918.90 QSE/CRRAH Level Segment Total Charges and Credits ($) Abs of Charges and Credits ($) Total Allocation of uplift ($) $509,098,026.35 705,345,143.39 Ratio Share Gen Load Load and Gen 287,605.67 398,471.90 11.50% 15.94% 1,906,107,501.70 638,276,587.94 1,076,820.75 360,582.74 43.07% 14.42% 4,425,312,918.90 Trader CRRAH Only Total 666,485,659.52 4,425,312,918.90 376,518.94 2,500,000.00 15.06% 100.00% Total amount uplifted in this example is $2,500,000, which is the maximum monthly amount for ERCOT s current default uplift allocation. 10 ERCOT Public
Count of Participants Following table is a count of participants for analysis. This count is based on the number of participants in summer 2021. Segment Gen Load Load and Gen Trader Nb. CP Nb. QSE/CRR 35 32 32 143 96 34 236 125 CRRAH Only Total 35 232 741 259 11 ERCOT Public
Appendix April 21, 2021 update to CWG/MCWG 12 ERCOT Public
4. Estimated Default Uplift Shares Mark Ruane Sr. Director, Settlements, Retail and Credit CWG / MCWG ERCOT Public April 21, 2021
Estimated Default Uplift Shares by Segment ERCOT has estimated default uplift shares for February short-pays by market segment. Per Protocol section 9.19.1, default uplifts are based on market activity in the month prior to that of the short-pays. NPRR 1074, mp Definition Revision, clarifies that uplift allocations are made to existing QSEs and CRRAHs. nb ERCOT will be filing clarifying comments before TAC. As detailed in ERCOT s Notice of Planned Implementation of Default Uplift Invoice Process, filed under PUC Project 51812, and accompanying Market Notice M-B041421-01, ERCOT considers Protocol Section 9.19.1 to require that Default Uplift Invoices be issued to: Currently-registered QSEs and CRRAHs, and QSEs and CRRAHs that have voluntarily terminated their registration. 14 ERCOT Public
Estimated Default Uplift Shares by Segment The estimated default allocations are made on this basis. Therefore, the activity of the following terminated Counter-Parties is excluded from January MWh activity: EAGLES VIEW PARTNERS LTD (CP) ENERGY MONGER LLC (CP) ENTRUST ENERGY INC (CP) GBPOWER LLC (CP) GRIDDY ENERGY LLC (CP) GRIDPLUS TEXAS INC (CP) ILUMINAR ENERGY LLC (CP) MQE LLC (CP) POWER OF TEXAS HOLDINGS INC VIRTUAL (CP) VOLT ELECTRICITY PROVIDER LP (CP) The activity of other short-paying Counter-Parties is included, and they will therefore be issued Default Uplift Invoices. 15 ERCOT Public
Estimated Default Uplift Shares by Segment # Counter- Parties January MMA Total (MWh) January MMARS % Segment January MMA (MWh) Gen Load Load and Gen Trader CRRAH Only Inactive Total 28 28 33 120 29 5,111,155.62 11,775,576.00 94,398,323.87 99,928,275.50 7,293,961.60 69,818.70 218,577,111.29 2.34% 5.39% 43.19% 45.72% 3.34% 0.03% 100.00% 218,577,111 3 241 Approximately half of the allocation is driven by CRR activity. Individual Counter-Party share reports are expected to be posted to MIS on Monday, April 26, 2021. 16 ERCOT Public
Estimated Default Uplift Shares by Segment Potential Uplift in TPE TPE includes a factor for Potential Uplift (PUL) Per Protocol Section 16.11.4.1, PUL includes: a) Amounts expected to be uplifted within one year of the date of the calculation; and b) 25%, or such other percentage based on available statistics regarding payment default under bankruptcy reorganization plans, of any short payment amounts being repaid to ERCOT under a bankruptcy reorganization plan that are due more than one year from the date of the calculation. There is no amount currently in (b). The expected one-year uplift is $30 million ($2.5 million/month) 17 ERCOT Public
Estimated Default Uplift Shares by Segment The average one-year estimated default uplift allocation among all Counter-Parties is $124,481, and the median is $19,525. One-Year Default Allocation Share 250 200 # Counter-Parties 150 100 50 0 18 ERCOT Public
Estimated Default Uplift Shares by Segment ERCOT expects to adjust the PUL component of TPE after Counter- Party share reports are posted on April 26th. The PUL adjustment will be for one year of Counter-Party expected uplift ($30m * activity share ratio). In addition, ERCOT will adjust TPE for voluntarily terminating Market Participants with their total accrued Default Uplift obligation. ERCOT does not expect to issue Default Uplift Invoices any sooner that the scheduled end of the legislative session on May 31, 2021. 19 ERCOT Public
Default Uplift Discussion 2 0 ERCOT Public