Economic Forecast Highlights: Federal & Washington State Unemployment Data Comparison
Explore the latest economic forecasts and unemployment data for the Federal and Washington State, including job losses, GDP growth projections, and unemployment rates. Compare trends from recent years to gain insights into the economic landscape. Discover key statistics and analysis in this comprehensive overview.

Download Presentation

Please find below an Image/Link to download the presentation.
The content on the website is provided AS IS for your information and personal use only. It may not be sold, licensed, or shared on other websites without obtaining consent from the author. If you encounter any issues during the download, it is possible that the publisher has removed the file from their server.
You are allowed to download the files provided on this website for personal or commercial use, subject to the condition that they are used lawfully. All files are the property of their respective owners.
The content on the website is provided AS IS for your information and personal use only. It may not be sold, licensed, or shared on other websites without obtaining consent from the author.
E N D
Presentation Transcript
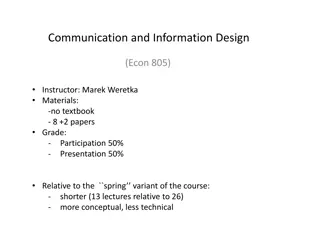
Annual Economic Forecast Breakfast Whatcom Business Alliance Dann Mead Smith February 25, 2020 1
Federal Employment The national unemployment rate was 3.5% in January 2020. Last time the rate was this low was in December 1969.1 113 months of straight growth from Sept. 2010 - February 2020.2 Lost 1.4 million jobs in March and 20.8 million jobs in April. Job reduction by education between Dec 2019 Dec 20202: 0% change for BA or more, -8.2% for some college, -7.4% for high school, and -11.3% for less than high school 55.2% of lost jobs returned by the end of 20202: 1 https://data.bls.gov/timeseries/LNS14000000 2 Abernathy, T. (Jan 26, 2021) AWB. Looking Back & Forward the Washington Economy. https://econleadership.sharefile.com/share/view/s94c0e5141d5b4b8389a2edcd0a5eebed 2
Federal Employment Unemployment nationally was 6.3% in January 2021. The last time it was this high (outside of 2020) was March 2014.1 In January 2021, 10.1 million persons were unemployed, a reduction from 10.7 million in December.3 US GDP Growth is expected to be -3.7% 20202: High for Western countries, compared to Germany (-5.4%) and UK (-11.3%) Below China (1.9%) and South Korea (-1.1%) US GDP growth projected to be 3.6% 2021.2 Low compared to Germany (4.6%) and UK (6.9%), and China (7.3%). Above South Korea (2.4%) 3 US Bureau of Labor Statistics, The Employment Situation January 2021. https://www.bls.gov/news.release/pdf/empsit.pdf 3
Washington State unemployment was 7.1% in December of 2020. The last time (outside of 2020) that it was this high was in June 2013.4 WA State unemployment rate was 4.3% in December of 2019.5 Number of Workers receiving layoff notices is the highest since 2009. Total Nonfarm Employment has decreased 6.0% between Dec 2019 Dec 2020.6 Washington GDP growth forecast (Nov 2020):7 2020: -3.7% decline 2021: 3.8% increase Washington State Employment 4 Washington State Employment Security Department, Monthly employment report, see link to charts and tables. https://esd.wa.gov/labormarketinfo/monthly-employment-report 5 Washington State Employment Security Department, December 2019 Monthly Employment Report. https://esd.wa.gov/newsroom/december-2019-monthly-employment- report#:~:text=%2320%2D003&text=OLYMPIA%20%E2%80%93%20Washington's%20economy%20gained%2010%2C900,to%20the%20Employment%20Security%20Department. 6 US Bureau of Labor Statistics, Change in total nonfarm employment by state, over-the-month and over-the-year, seasonally adjusted, https://www.bls.gov/web/laus/statewide_otm_oty_change.htm 7 Washington State Economic and Revenue Forecast Council (Nov. 3, 2020). Economic Review. https://erfc.wa.gov/sites/default/files/public/documents/forecasts/ec20201103.pdf 4
Between December 2019 and December 2020, 189,000 net jobs were lost in Washington (not seasonally adjusted).8 Largest losses (Nov 19 Nov 20) were in Manufacturing (-8.8%) and Leisure & Hospitality (- 24.7%). Professional & Technical Services saw a 4% increase.2 Seasonally adjusted private sector lost 10,600 jobs and public sector gained 700 jobs in December 2020: 9,900 total job loss.8 Unemployment rate increased 3.1% from Dec. 2019 - Dec. 2020. Ranked 36th in unemployment change.26 Comparison with other states: 1st: South Dakota (3.4% - 3.0%, unemployment down 0.4%) Neighbors: Idaho (1.5% increase, 19th place) and Oregon (3.0% increase, 34th place).26 Washington State Employment 8 Washington State Employment Security Department,(Dec 2020) Monthly employment report. https://esdorchardstorage.blob.core.windows.net/esdwa/Default/ESDWAGOV/labor-market-info/Libraries/Economic-reports/MER/MER%202020/MER-2020-12.pdf 26 Bureau of Labor Statistics, Over-the-Year Change in Unemployment Rates for States. https://www.bls.gov/web/laus/laumstch.htm 5
WA State Unemployment Rate Projections7 2020 2021 2022 2023 2024 2025 November Forecast, Preliminary 8.3% 6.5% 5.1% 4.6% 4.3% 4.3% 6
7 7
Washington personal income rose from $506.1 billion in the Q1 2020 to $544.4 billion in Q2,2020 before dropping to $534.2 billion in Q3 2020 (all SAAR).9 -7.3% growth rate (SAAR) in Washington personal income in Q3 2020 was the ninth best among states and better than our two neighbors.10 Best state: Georgia (-0.6%) Worst state: West Virginia (-29.9%) Idaho: 29th (-20.5), Oregon: 18th (-11.3%) Seattle area consumer price inflation rose 2.5% in 2019 compared to the 1.8% increase in the U.S. City Average. Projections for 2020 published November 2020 are that the Seattle CPI will rise 1.9% compared to a U.S. city Average CPI increase of 1.3%.11 Washington State Income and Inflation 9 Bureau of Economic Analysis. GDP and Personal Income. https://apps.bea.gov/iTable/iTable.cfm?reqid=70&step=1&acrdn=2 10 Bureau of Economic Analysis. Personal Income by State, 3rd Quarter 2020. https://www.bea.gov/sites/default/files/2020-12/spi1220.pdf 11 Washington State Economic and Revenue Forecast Council (Nov 2020), Washington State Economic and Revenue Forecast. https://erfc.wa.gov/sites/default/files/public/documents/publications/nov20pub.pdf 8
7 9
WA Trade12 12 Washington State Economic and Revenue Forecast Council (Sept. 3, 2020). Economic Review. https://erfc.wa.gov/sites/default/fi les/public/documents/forecasts/e c20200903.pdf 10
Recession Indicator The number of workers in WA receiving layoff notices in 2020 was the highest since 2009. There is a heightened risk of downturn in construction in WA. WA year-over-year exports decreased 43% in the second quarter 2020.7 Threats to economic expansion include concerns about international trade and fiscal policy, geopolitical risks and maturing expansion. Estimate is that we will not be back to pre-Pandemic economic activity until 4th Qtr. 2021 (per business travel, office space demand, retail and small businesses returning, surviving). What has remained strong though is residential real estate 11
Whatcom County Employment Unemployment rate in Bellingham/Whatcom County: 7.2% (as of December 2020).13, 14 As compared to Washington State 7.1%.8 Unemployment rate December 2019 in Bellingham and Whatcom County: 4.7%.13, 14 Since 1990 the unemployment rate of Bellingham peaked at 11.1% in February 2010.14 Whatcom County has about 100,000 non-farm jobs. Whatcom County lost 13,200 jobs from February to April, of which 9,100 were recovered by September.15 Bellingham in top 20 metro areas forecasting highest percentage of job losses.16 If current restrictions remain, job loss could be around 6,000. 13 US Bureau of Labor Statistics, Bellingham, WA. https://www.bls.gov/eag/eag.wa_bellingham_msa.htm 14 Federal Reserve Bank of St. Louis Economic Research, Unemployment Rate in Whatcom County, WA. https://fred.stlouisfed.org/series/WAWHAT5URN 15 Vance-Sherman, A. 16 Pardue, L. Gusto. Impact Winter: Analyzing the Potential Effects of Cold Weather in the Quarantine Economy. https://gusto.com/company-news/gusto- winter-2020-jobs-report 12
Whatcom County Employment Largest contributors to GDP in Whatcom County include manufacturing (especially nondurable goods), retail trade, real estate and government.17 Average wage (2018): $47,771, below statewide of $66,195.17 County median hourly wage (2018): $22.12; state: $25.98.17 Average per capita personal income: $48,792; state: $62,026; USA: $54,446.17 The Bellingham metro area (Whatcom County) ranked 20th highest metro areas best employment growth (May 2014-2019 USA Today).18 17 Vance-Sherman, A (Updated Jan 2020), Washington State Employment Security Department. Whatcom County profile. https://esd.wa.gov/labormarketinfo/county-profiles/whatcom 18 Stebbins, S (Jul. 30, 2019) These cities are adding the most jobs. https://www.usatoday.com/story/money/2019/07/30/jobs-these-cities-adding-most-jobs-employment- growth/39806157/ 13
Bellingham Ranked Best Performing19 Milken Institute identified top performing U.S. cities: Bellingham metro area continues to stay on their list of best-performing small U.S. cities. Ranked 12th among small U.S. cities - Bellingham metro area (Whatcom County) had strong scores in high-tech growth and broadband access. Scored poorly in housing affordability - Report warned that the housing affordability issue if not addressed (housing growth not keeping up with wage growth) could have negative long-term impact on the local economy. Median home sale price for Whatcom County rose 10.5% in a year to $442,000 in 2020. (Bellingham median price for homes sold was $523,500). Whatcom/Bellingham ranked 10th in 2019/last report. The new report also noted that Bellingham has a strong base of manufacturing jobs, particularly with two refineries in the area, but this was before the Alcoa closure. 19 Galdamez, M., Kesteven, C., Melaas, A. Milken Institute. Best-Performing Cities 2021. https://milkeninstitute.org/sites/default/files/reports- pdf/Best-Performing-Cities-2021.pdf 14
US-Canada Border The Border Policy Research Institute at WWU published a series of reports on the impact of COVID on the US-Canada Border. Findings are as follows: In 2018, Canadians comprised up to (estimated) 41% or about $152 million of Whatcom County s retail sales (general merchandise category) and up to 44% ($51 million) in the clothing/clothing accessory category.20 In 2019, Canadians purchasing gas likely comprised up to 73% of Blaine s fuel tax revenue.20 It is estimated that retail sales in Whatcom County fell by $54-$65 million in Q1 and Q2 of 2020 (most recent data) due to the COVID-19 border restrictions - 5%- 6% decrease in total retail sales compared to 2019. However, because many Canadians also cross to purchase gas and dairy products two commodities that are not measured in taxable retail sales data the true decrease in retail sales is likely much greater.20 19 Border Policy Research Institute, Western Washington University, (Spring 2020). COVID-19 and the US-Canada Border Report 1: COVID-19 and the US-Canada Border: Retail Shopping Destinations for Canadians in Whatcom County. https://cedar.wwu.edu/cgi/viewcontent.cgi?article=1118&context=bpri_publications 20 Border Policy Research Institute, Western Washington University, (Summer 2020). COVID-19 and the US-Canada Border Report 2: Canadians and Taxable Retail Sales within Whatcom County. https://cedar.wwu.edu/cgi/viewcontent.cgi?article=1121&context=bpri_publications 15
US-Canada Border Daily border crossings remain at 98% below typical levels.21 The restrictions also limit leisure in Whatcom County; over 506,000 (about 13%) Canadian tourists were lost between March-September 2020.22 Up to 70% of Bellingham Airport s passengers are typically Canadian and the total number of enplaned passengers was down by 70% (as of September 2020).22 An estimated 7% of the County s homeowners are Canadians/dual-citizens; border restrictions and the federal quarantine in Canada limit access to Canadian-owned vacation/second homes.22 21 Border Policy Research Institute, Western Washington University, (Spring 2020). COVID-19 and the US-Canada Border Report 1: COVID-19 and the US-Canada Border: Retail Shopping Destinations for Canadians in Whatcom County. https://cedar.wwu.edu/cgi/viewcontent.cgi?article=1118&context=bpri_publications 22 Border Policy Research Institute, Western Washington University, (Fall 2020). COVID-19 and the US-Canada Border Report 3: Impacts on the Tourism Industry in Whatcom County. https://cedar.wwu.edu/cgi/viewcontent.cgi?article=1123&context=bpri_publications 16
Beyond Minimum Wage: Paid Family and Medical Leave Beginning in 2020 every worker in the state was be eligible to collect nation s most generous paid family and medical leave benefit. Workers who clock 820 hours are eligible.23 Can be used for birth/adoption of child, care for a sick family member or for workers own serious health condition.20 Up to 16 weeks of paid leave with max $1,206 weekly benefit.23 Funded by payroll tax on employers & workers: Employers pay 37% and workers pay 63%.24 2019 brought additional payroll withholdings to fund the paid family and medical leave premiums Premiums are .4% of gross wages (started in 2019) Proposed changes: HB 1073 Would shift minimum eligibility from 820 hours worked to $1,000 earn Definition of family member expanded to include any blood relation or affinity equivalent of family member. Job protection threshold moved from 12 months to 90 days worked. 23 Washington Paid Family & Medical Leave. Find out how Paid Leave works. https://paidleave.wa.gov/find-out-how-paid-leave-works/ 24 Washington Paid Family & Medical Leave. Your role and responsibilities. https://paidleave.wa.gov/employer-roles- responsibilities/#:~:text=Paid%20Family%20and%20Medical%20Leave%20is%20funded%20by%20premiums%20paid,2020%3B%20%24142%2C800%20in%20202 17
2021 Legislative Session State Senate: Virtual; limited legislative capacity and little public access to members of the legislature Focus is on the state budget, taxes, and new types of COVID relief Income tax on capital gains State House: Democrat: 28 Republican: 21 Democrat: 57 Republican: 41 18
Capital Gains Income Tax Proposal in 2021 SB 5096/HB 1496 Introduced 2021 Key findings: 1. There is no question these proposals would impose an income tax in Washington state. The Federal Internal Revenue Service (IRS) unequivocally says a capital gains tax is an income tax. 2. If enacted, these proposals would be the first stand-alone income tax on capital gains in the country. 3. No other state without a personal income tax has a capital gains tax, and those states that do tax capital gains income collect the tax through their state income tax code. 19
Capital Gains Income Tax Key Findings Continued 4. Officials in every state revenue department across the country agree that income taxes on capital gains are extremely volatile and unpredictable. 5. If enacted, the income tax on capital gains would certainly face legal challenges for being an unconstitutional tax on income. Washington s Department of Commerce has made the state s lack of an income tax a major selling point for its Choose Washington campaign. 6. 20
Capital Gains Income Tax Proposal in 2021 Capital gains taxes are income taxes according to every state and now the IRS; no state calls a capital gains tax on excise tax Passage would lead to a court challenge on constitutional grounds First step to a statewide general income tax Income taxes are volatile revenue sources 21
WA State Budget WA State doesn t have a revenue problem, it has a spending problem The current 2019-21 state budget is $53.3B. Governor s proposal is to increase by 8% to $57.6B between 2021-23. State spending has already increase by about 77% over the last 10 years No budget deficit. 2019-21 budget is balanced. 22
WA State Revenue 25 25 Washington State Economic and Revenue Forecast Council (Nov. 18, 2020). Revenue Review and Budget Outlook Adoption. https://erfc.wa.gov/sites/default/files/public/documents/ forecasts/ec20201103.pdf 23
Revenue Still Increasing From the November 2020 Revenue Forecast: Total state revenues are now expected to grow 10.7% between the 2017-19 and 2019-21 biennia and 7.2% between the 2019-21 and 2021-23 biennia. 20 February 2021 monthly tax collections update: "Cumulatively, collections are now $592.6 million (9.0%) higher than forecasted." 24
Various New Tax Proposals New $3.25 per person, per month tax on health insurance plans. Income tax on capital gains Seattle-styled statewide employer compensation tax Wealth tax Statewide soda tax Business tax preferences repeal Wireless devices tax New 40% top rate for death/estate tax Carbon Tax/Low Carbon Fuel Standard Gas tax/Vehicle fees 25
What Matters to Small Business Owners Business friendly environment Reasonable costs of doing business Ease of navigating state rules and regulations Streamlined regulatory compliance Predictability Low taxes 27
Improving the small business climate in Washington state ( Recommendations from Dec 2019 WPC small business study) Reduce or replace the B&O tax (gross receipts tax) Reform workers compensation insurance monopoly to a mixed or privatized system Allow a tiered minimum wage system Allow a training minimum wage One-stop shop to file, start and operate a small business Eliminate the Estate Tax Reduce state health insurance mandates Open insurance to be purchased across state lines Eliminate at least five outdated regulations for every one new regulation adopted Eliminate title-only bills in state legislature Do not add burdens that would hinder recovery from COVID-19 28
Thank You! Questions? dmeadsmith@washingtonpolicy.org 206-946-1014 29