Economic Impact Analysis of Governors State University in Illinois
Explore the economic contribution of Governors State University to Will, Cook, and Kankakee counties in Illinois through a detailed analysis of its direct, indirect, and induced impact on the local economy. Discover the significance of GSU's spending in FY2022, including its gross output, labor income generation, employment impact, and input-output multiplier. Uncover the multi-faceted economic effects of GSU's operations and funding sources on the regional economy.

Uploaded on | 3 Views
Download Presentation

Please find below an Image/Link to download the presentation.
The content on the website is provided AS IS for your information and personal use only. It may not be sold, licensed, or shared on other websites without obtaining consent from the author. If you encounter any issues during the download, it is possible that the publisher has removed the file from their server.
You are allowed to download the files provided on this website for personal or commercial use, subject to the condition that they are used lawfully. All files are the property of their respective owners.
The content on the website is provided AS IS for your information and personal use only. It may not be sold, licensed, or shared on other websites without obtaining consent from the author.
E N D
Presentation Transcript
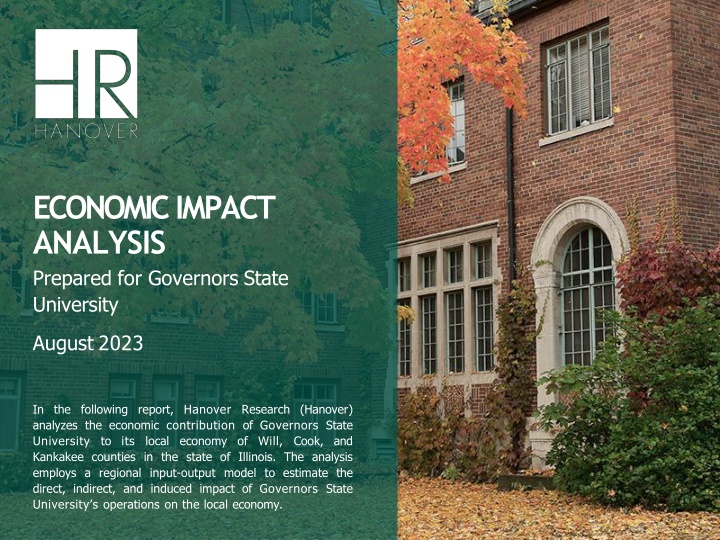
ECONOMIC IMPACT ANALYSIS Prepared for Governors State University August 2023 In the following report, Hanover Research (Hanover) analyzes the economic contribution of Governors State University to its local economy of Will, Cook, and Kankakee counties in the state of Illinois. The analysis employs a regional input-output model to estimate the direct, indirect, and induced impact of Governors State University s operations on the local economy.
TABLE OF CONTENTS Demand-Side Analysis 3 / Demand-Side Overview 4 / Demand-Side Analysis 6 / Supply-Side Analysis 8 / Supply-Side Overview 9 / Contribution to Local High-Demand Fields 10 / Economic ValueAdded Analysis 11 / HIGHER EDUCATION 2
DEMAND-SIDE OVERVIEW OVERVIEW AND KEY FINDINGS DEMAND-SIDE ECONOMIC IMPACT The demand-side analysis estimates the effect of spending by Governors State University (GSU) on the Will, Cook, and Kankakee counties in the state of Illinois. The effect represents both the initial spending by GSU (typically referred to as the direct effect) and the additional economic activity in other areas of the economy triggered by this initial spending (indirect and induced effects). $120M GROSS OUTPUT The overall estimated annual demand-side economic impact of GSU is about $120M in FY2022.1 GSU s externally funded spending also generated $69M in FY2022 in labor income. As for employment impact, GSU supported approximately 1,078 jobs in FY2022. $69M The impact of GSU reflects an input-output multiplier of 1.77 in FY2022. In other words, for every dollar of spending by GSU and its students in the area of analysis, there is an additional impact of $0.77 in FY2022 on the local economy, or a total impact $1.77. LABOR INCOME 1,078 EMPLOYMENT IMPACT 1 Note that dollar values are reported in 2022 dollars. HIGHER EDUCATION 4
DEMAND-SIDE OVERVIEW SCOPE OVERVIEW AREA OF ANALYSIS: Will, Cook, and Kankakee counties As part of the demand-side economic impact analysis, Hanover Research analyzes the contributions of GSU to the economy of Will, Cook, and Kankakee counties using an Input-Output Model to estimate the direct, indirect, and induced effects on local economy including: YEAR OF ANALYSIS: FY2022 The impact of GSU s operating and capital spending Funding/spending generated from out-of-area sources TYPES OF DEMAND-SIDE ECONOMIC IMPACT Induced Effect The effect of direct and indirect spending on local, individual household purchase s Indirect Effect Local business-to- business spending within area Initial spending on payroll, operations, and capital purchases. Spending by out-of- area students. Direct Effect HIGHER EDUCATION 5
DEMAND-SIDE: GROSS OUTPUT (FY2022) Gross Output $120,288,953 In fiscal year 2022, GSU s activities yielded an estimated gross output impact of $120 million on the local economy. Based exclusively on spending funded by out-of-area dollars, these economic activities would otherwise be unlikely to occur in the area without GSU. The direct effect of GSU s operation that was funded by external dollars was $68 million, which includes operating expenditures and capital expenses of $60 million and $0.9 million, respectively, as well as out-of-area student off- campus spending of $6.6 million. Direct Effect Indirect Effect Induced Effect $15,881,057 $67,930,286 $36,477,610 Taken together, this externally-funded operating, capital, and student spending triggered additional indirect business-to- business spending of $16 million and induced household spending of $36 million in the area of analysis. Therefore, the direct output effect of GSU s operating, capital, and student spending generated an estimated $52,358,667 in additional economic activity among businesses and households in Will, Cook, and Kankakee counties. $0 $30,000,000 $60,000,000 $90,000,000 $120,000,000 Breakdown of $68 Million Direct Effect: $60,468,773 Operating Expenditure $890,180 Capital Expenditure $6,571,332 Student Spending HIGHER EDUCATION 6
DEMAND-SIDE: LABOR INCOME & EMPLOYMENT IMPACT (FY2022) Labor Income $68,627,130 Representing a key subset of growth output, GSU s externally funded operating, capital, and student spending generated an estimated $69 million in labor income. This includes salaries, wages, and benefits earned by employees and business owners throughout the local economy. Direct Effect Indirect Effect Induced Effect This labor income value includes a direct effect of $50 million, coupled with $5.4 million in indirect effects, and $13 million in induced effects. Therefore, GSU generated an estimated $18,763,126 in additional labor income among households and businesses in the area of analysis. $5,389,993 $49,864,004 $13,373,134 $0 $14,000,000 $28,000,000 $42,000,000 $56,000,000 $70,000,000 In terms of employment impact, GSU s externally funded operating, capital, and student spending supported an estimated 1,078.3 jobs throughout the local economy during the 2022 fiscal year. This figure comprises 823.9 jobs supported by direct spending from GSU and its out-of-area students, as well as 66.2 jobs supported by business-to-business (indirect) spending and 188.2 jobs supported by household (induced) spending. Employment Impact 1,078.3 Direct Effect Indirect Effect Induced Effect 823.9 66.2 188.2 0 100 200 300 400 500 600 700 800 900 1,000 1,100 HIGHER EDUCATION 7
SUPPLY-SIDE OVERVIEW Hanover Research s Supply-Side Economic Impact Analysis is organized into three main components: SIGNIFICANT SUPPLY-SIDE ECONOMIC CONTRIBUTIONS Academic Impact analyzes the impact of Governors State University s academic programs on Cook, Will, and Kankakee Counties, including snapshots of student enrollment, academic rankings, and the alignment between degree offerings and employment demand 4,358 enrollments in 2022 Alumni Impact evaluates the impact Governors State University alumni have on the community, including estimated additional earnings as a result of receiving their degree Ranked #26 Regionally in Social Mobility by U.S. News and World Report Community Engagement and Impact evaluates the impact of Governors State University s programs and events on the Cook, Will, and Kankakee County communities Estimated additional graduate income of $30,788,464 in 2022 Quantifiable contributions include 4,358 students enrolled in 2022; and an estimated $31 million in additional annual income earned by graduates remaining in the local area. Governors State University students, staff, and alumni also contribute to the community via the Center for Performing Arts initiatives and events, community service both in the local area and beyond, and workforce development via the School of Extended Learning. 46% of students do not pay out-of- pocket HIGHER EDUCATION 9
CONTRIBUTION TO LOCAL HIGH-DEMAND FIELDS AREA OCCUPATIONS WITH PROJECTED WORKFORCE SHORTFALLS The graph below shows the projected annual average occupational employment gaps for associate or above-level occupations in the three-county GSU service area. Occupations shown in orange align with at least one GSU program. REGIONAL WORKFORCE CONTRIBUTIONS A Chmura Economics & Analytics analysis of 2022-2032 occupational employment trends for the GSU service area identifies more than 100 occupations in which the projected number of job vacancies is likely to exceed the region s available workforce, and which align with a degree field offered by GSU. For example, experts expect that there will be 321 more software development positions in the three-county service area than workers qualified to fill those roles every year over the next decade. Software Developers ($123,500) -321 General and Operations Managers ($135,700) -306 GSU s contribution to the local economy is highlighted by its academic programs aligning with seven of the top 10 occupations with predicted regional worker shortages. Many of these positions are in healthcare, business, and technology roles. Access to talent is becoming an acute economic problem in the wake of the COVID-19 pandemic. GSU s contributions to the local workforce will help the region remain economically competitive and attractive to employers in the coming years. Financial Managers ($160,900) -188 Market Research Analysts and Marketing Specialists ($76,600) -141 Registered Nurses ($88,600) -131 Medical and Health Services Managers ($140,900) -117 METHODOLOGY NOTE Hanover matched high-demand occupations with GSU programs by evaluating the GSU program lists and degree conferrals data. Hanover also consulted the current Bureau of Labor Statistics and National Center for Educational Statistics Crosswalk, which links programs of study to occupations. Management Analysts ($123,700) -109 Nurse Practitioners ($135,000) -87 Logisticians ($69,500) -73 Personal Financial Advisors ($129,100) -66 HIGHER EDUCATION 10
ECONOMIC VALUEADDED ANALYSIS ANNUAL EARNINGS BY LEVEL OF EDUCATIONAL ATTAINMENT, ILLINOIS Based on undergraduate earnings data provided by GSU and average wage data by educational attainment level reported by the U.S. Census Bureau. GSU gradate mean annual earnings not provided. Governors State University makes a significant economic contribution via increased economic mobility and earnings power for graduates. The Bureau of Labor Statistics finds that average income for a worker over 25 increases with each educational credential earned; the highest salaries are awarded to workers with a doctoral or professional degree. Additionally, unemployment rates decrease with each credential earned. Graduate or Professional Degree $81,737 GSU Undergraduate Mean $64,270 Hanover conducts a regional valueadded analysis, intended to provide a broad illustration of the potential monetary value graduates of Governors State University programs receive via increased earnings. To estimate this value, Hanover cross- referenced GSU s number of graduates and average graduate earnings in 2022 with the differences between median income for individuals holding bachelor s or graduate degrees and those completing the prior level of educational attainment. To estimate the number of graduates within the region, Hanover weighted conferrals by the percentage of alumni remaining within 50 miles of the institution according to GSU s 2022 annual report. Hanover uses data provided by Governors State University for this analysis. This analysis makes several assumptions: Bachelor's Degree $63,725 Associate's Degree $41,652 High School Diploma or Equivalent $35,334 SALARY PREMIUM BY LEVEL OF EDUCATIONAL ATTAINMENT FOR ILLINOIS WORKERS Educational Attainment Premium $28,936 (over HS Diploma) Assumes all in-area graduates earn at least the alumni survey mean or state median for that degree level. GSU Bachelor s Degree* $22,618 (over Associate) Does not account for variations by degree type or specialization. Does not account for variations based on age or experience level. Graduate or Professional Degree** $17,467 (over GSU Undergrad) *Source: GSU undergraduate wages based on survey of GSU undergraduate alumni **Source: Median wages by educational attainment from US Census Bureau; GSU graduate wages unavailable. HIGHER EDUCATION 11
ECONOMIC VALUEADDED ANALYSIS DEGREE CONFERRALS FROM GOVERNORS STATE UNIVERSITY, 2021 Total GSU conferrals and adjusted in-area total GSU conferrals, or number of conferrals by percentage of in-area alumni. Governors State University reported 1,240 total degree conferrals in 2021. Of these, 796 were bachelor s degrees and 444 were graduate or professional degrees. Based on 2022 enrollment, approximately four percent of bachelor s students entered with an associate s degree, so Hanover estimates a separate value-added amount based on the differential between associate and bachelor s degrees. A total of seven graduate certificates were conferred, but these are excluded due to the lack of salary data associated with graduates of certificate programs. Total Adjusted In-Area Total 796 677 429 365 Based on value-added analysis, Governors State University s 2021 graduates represent approximately $29,641,852 in additional annual income, approximately $25.2 million of which remained in the immediate area. This additional income benefits the graduates themselves, but also increases potential spending within the local economy and increased tax revenue. 15 13 Doctoral/Professional Degree Bachelor's Degree Master's Degree Source: IPEDS ESTIMATED ANNUAL EARNINGS PREMIUM FOR GSU GRADUATES IN THE REGION, 2021 A total of 38,266 GSU alumni reside in Cook, Kankakee, and Will Counties. If each of these alum earn at least the mean bachelor s degree salary, the earnings differential for all alumni may potentially be in the range of $1,107,271,481. However, this does not account for additional graduate-level education among these alumni or career progression. As such, Hanover relies primarily on the earnings premium among recent graduates. Estimated Total Additional Annual Earnings (Year Grads)* Estimated Total Additional Annual Earnings (In-Area Grads)** Estimated Differential per Graduate Degree Level Bachelor s $28,936 $21,886,580 $18,603,593 Bachelor s from Associate $22,618 $896,257 $761,819 Graduate $17,467 $7,755,273 $6,591,982 Total $46,403 $29,641,852 $25,195,574 *Total GSU conferrals times the premium differential. **Adjusted in-area total GSU conferrals times the premium differential. HIGHER EDUCATION 12
CONTACT Emily Renne Content Director E: erenne@hanoverresearch.com P: 202-240-1862 hanoverresearch.com


")
")