Economic Impact of Infrastructure Expenditure in Rural Areas Forum
This document discusses the economic impact of provincial government infrastructure expenditure in rural areas of Mpumalanga Province, focusing on research, analysis, challenges, and recommendations. It covers the purpose, scope, criteria for rural classification, and data challenges related to infrastructure spending.

Download Presentation

Please find below an Image/Link to download the presentation.
The content on the website is provided AS IS for your information and personal use only. It may not be sold, licensed, or shared on other websites without obtaining consent from the author.If you encounter any issues during the download, it is possible that the publisher has removed the file from their server.
You are allowed to download the files provided on this website for personal or commercial use, subject to the condition that they are used lawfully. All files are the property of their respective owners.
The content on the website is provided AS IS for your information and personal use only. It may not be sold, licensed, or shared on other websites without obtaining consent from the author.
E N D
Presentation Transcript
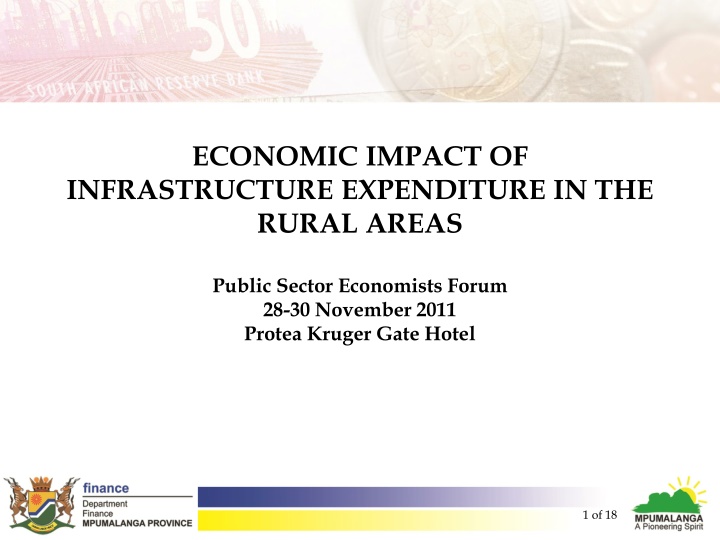
ECONOMIC IMPACT OF INFRASTRUCTURE EXPENDITURE IN THE RURAL AREAS Public Sector Economists Forum 28-30 November 2011 Protea Kruger Gate Hotel 1 of 18
CONTENTS Purpose & Scope Criteria for Rural/Urban Classification Provincial Government Infrastructure Expenditure in Rural Municipal Areas Economic Impact of Provincial Government Infrastructure Expenditure in Rural Municipal Areas Challenges & Recommendations 2 of 18
PURPOSE & SCOPE A core function of Provincial Treasury is to provide economic and social research and analysis that informs the fiscal policy development and the annual budget process. According to the 2007/2008 report of the Portfolio Committee on Finance (Mpumalanga), the Economic Analysis Unit should assess the impact that government s services-delivery has on the lives of the citizens of this province on a continuous basis. Main objective of the study was to quantify the economic impact of provincial government infrastructure expenditure in rural areas of the Mpumalanga Province, in line with MTSF priorities. Scope of study 1. Theoretical framework/study 2. Rural development in Mpumalanga 3. Assessment of provincial government infrastructure spending in the rural areas 4. Economic impact of provincial government infrastructure spending in the rural areas - SAM 5. Challenges & recommendations Data challenges of study 3 of 18
CRITERIA FOR CLASSIFICATION OF RURAL Defining rural areas has been contentious both nationally & internationally No standard national or international definition - therefore no commonly accepted criteria to be used when attempting to classify an area as rural International benchmarks: North American & European countries define rural areas as 400 people per km2 BUT for Australia 200 people per km2 StatsSA - reliance on one criterion for classification is insufficient & ineffective StatsSA suggest looking at the following three broad areas: 1. Economic criteria Contribution to economic activity 2. Demographic indicators Population density 3. Urban characteristics Classification of town size Finance & service provider agreed on the use of economic contribution, population density, town classification & COGTA classification as the four classification criteria 4 of 18
CRITERIA FOR CLASSIFICATION OF RURAL HOMT Higher Order Medium- sized Town CoGTA Classification District & Local Municipalities GDPR Contribution Population Density Town Classification Urban/Rural Ehlanzeni Mbombela 16.3* Rural 151.76* Major town* Urban Rural Bushbuckridge 3.1% 197.92* LOMT* Rural Rural Nkomazi 1.8% 105.27 Rural HOST Higher Order Small- sized town Rural Thaba Chweu 3.1% 14.69 HOST* Rural Rural Umjidi 1.6% 34.28 HOST* Rural Gert Sibande Albert Luthuli Rural 1.6% 34.94 Rural Rural Dipaseleng 0.6% 14.51 Rural Urban* Govan Mbeki 19.3%* 87.27 2x HOST* Urban LOMT Lower Order Medium- sized Town The town classification measure was developed by the CSIR and is provided within their Geospatial Analysis Platform developed in 2007. In using this classification, local municipalities that contained only very small villages were classified as rural for this criterion. Rural Lekwa 3.6% 19.85 Rural Rural Mkhondo 1.5% 22.66 Rural Rural Msukaligwa 3.7% 20.8 2x HOST* Rural Rural Pixley ka Seme 1.1% 12.84 Rural Nkangala Emalahleni * Urban* 20.5%* 154.95* HOMT Urban Rural Emakhazeni 1.3% 7.12 Rural Rural Thembisile Hani 2.0% 112.71 Rural Rural Dr. JS Moroka 1.3% 174.79* Rural Urban* Steve Tshwete 15.7%* 43.63 LOMT* Urban Rural Delmas/Victor Khanye 1.9% 32.22 Rural Mpumalanga 1 47.01 5 of 18
INFRASTRUCTURE SPENDING IN THE RURAL AREAS Total infrastructure expenditure in Mpumalanga was R2.2 billion in 2009/10, amounting to 2.1% of provincial GVA Mpumalanga has the second lowest per capita spending on infrastructure relative to the other provinces, amounting to a mere R590 in 2009/10. Gauteng the highest per capita infrastructure spend at R1 197 It should be noted, though, that per capita spending on infrastructure has increased by just under 220% since 2006/07 6 of 18
INFRASTRUCTURE SPENDING IN THE RURAL AREAS Infrastructure expenditure by department, Mpumalanga, 2007/08-2009/10 100% 2.5% Social Development 90% 80% Public Works, Roads and Transport 42.1% 58.4% 70% Health 60% 81.4% Percent 50% 23.9% Education 40% 15.2% 30% Culture, Sport and Recreation 17.2% 20% 19.5% 3.3% 10% 16.8% Agriculture, Rural Development and Land Administration 1.7% 11.1% 5.3% 0.9% 0.8% 2007/08 0% 2008/09 2009/10 7 of 18
INFRASTRUCTURE SPENDING IN THE RURAL AREAS Infrastructure expenditure as a share of total expenditure by Department, Mpumalanga, 2009/10 Public Works, Roads and Transport 35% Agriculture, Rural Development and Land Administration 30% Culture, Sport and Recreation 26% Health 10% Social Development 7% Education 4% 0% 5% 10% 15% 20% Percent 25% 30% 35% 40% 8 of 18
INFRASTRUCTURE SPENDING IN THE RURAL AREAS Department of Public Works, Roads and Transport Department of Health Department of Education Total infrastructure spending: R928 million in 2009/10 (35% of budget) Total infrastructure spending: R526 million in 2009/10 (10% of budget) Total infrastructure spending: R379 million in 2009/10 (4% of budget) Rural share of infrastructure spending declined from 75% in 2006/07 to 41% in 2009/10 Spent a relatively small share of its infrastructure budget in rural municipalities averaging 37% between 2006/07 and 2009/10 Between 2006/07 and 2009/10, an average of 75% of this department s infrastructure budget was spent in rural areas Rural share of infrastructure spending averaging 60% between 2006/07 and 2009/10 Increase in infrastructure budget over review period Most infrastructure spending is concentrated on the upgrading of school buildings, with the main beneficiaries of the 2009/10 year being Nzunza Mabhoko, Nalithuba and Mtimandze Secondary Schools A large share of infrastructure spending in this department can be attributed to projects that include road upgrades, storm water drainage and design of coal haulage routes The increase can be linked to the Trisano campaign, which was launched in 2009 with the aim of bringing integrated health services to rural areas 9 of 18
INFRASTRUCTURE SPENDING IN THE RURAL AREAS DARDLA Share of its infrastructure spending in rural municipal areas averaging 70% between 2006/7 and 2009/10 Culture, Sports & Recreation Averaging just less than 50% between 2007/8 and 2009/10 Human Settlements Averaging almost 60% between 2006/7 and 2009/10 Social Development Averaging 75% between 2007/8 and 2009/10 10 of 18
ECONOMIC IMPACT OF RURAL INFRASTRUCTURE SPENDING Methodology Social Accounting Matrix (SAM) for the province to model the economic impact SAM is a tool that sets out the framework for the structure of the economy It maps out the transactions that occur between different institutions within the economy & captures the full circular flow of the economy Multiplier analysis (developed by Leontief) to assess the impact of a change in one variable on the rest of the economy in our case we look at the effect on the provincial and national economy It enables us to quantify the direct, indirect and induced impacts of expenditure within the economy 11 of 18
ECONOMIC IMPACT OF RURAL INFRASTRUCTURE SPENDING E.g. building a hospital Construction businesses will undertake additional business activity Increase in the number of people it employs and the goods and services it demands in order to build and equip the hospital Additional people employed have more income to spend on consumption, to save therefore more income & indirect tax Businesses that supply construction businesses also have an increase in demand for their goods and services Increased business activity leads to increased corporate tax 12 of 18
ECONOMIC IMPACT OF RURAL INFRASTRUCTURE SPENDING Data Primary data source IRM database DARDLA & DPWRT inconsistency in data between different reporting forms data from budget statements used. IRM database used to inform rural-urban split Department of Human Settlements data directly from department Financial years evaluated Department Expenditure data Agriculture, Rural Development and Land Administration Budget statements 2006/07 2009/10 Culture, Sport and Recreation IRM database 2007/08 2009/10 Education IRM database 2006/07 2009/10 Health IRM database 2006/07 2009/10 Human Settlements Directly from department 2007/08 2009/10 Public Works, Roads and Transport Budget statements 2006/07 2009/10 Social Development IRM database 2007/08 2009/10 13 of 18
ECONOMIC IMPACT OF RURAL INFRASTRUCTURE SPENDING Region Indicator Capex and Opex (R million) 2006 2007 2008 2009 Total 2006-09 Mpumalanga R 637 R 849 R 997 R 835 R3 318 Initial expenditure R 743 R 977 R 1 169 R 1 002 R 3 891 Total impact on output 2 030 2 641 3 392 2 980 11 043 Total employment impact* R 264 R 348 R 409 R 349 R 1369 Total tax revenue South Africa R 1 324 R 1 743 R 2 086 R 1 786 R 6 940 Economy wide impact 3 461 4 526 5 658 4 922 18 567 Economy wide employment* Total impact on output was R3.9 billion, R1.4 billion in tax revenue & 11 043 in person years of employment created Rural infrastructure spending has a multiplier of approximately 1.17 For each R1 of rural infrastructure expenditure, total output impact was R1.17 Lower than those generated for the SA economy at 1.28 and 1.36 (multipliers for 2 different SA infrastructure mixes) 14 of 18
ECONOMIC IMPACT OF RURAL INFRASTRUCTURE SPENDING Indicator Agriculture (06/07-09/10) Culture (07/08-09/10) Education (06/07-09/10) Health (06/07-09/10) Human Settlements (06/07-09/10) Public Works (06/07-09/10) Social Total Development (07/08-09/10) Total expenditure (R-million) R132 R35 R848 R273 R11 R1 979 R41 R3 319 Total impact of expenditure (R-million) R171 R42 R1 025 R371 R14 R2 220 R48 R3 891 Expenditure multiplier 1.30 1.20 1.21 1.36 1.27 1.12 1.17 1.17 Total employment impact 427 157 4 003 876 36 5 332 212 11 043 Departments of Health, Agriculture and Human Settlements had largest multipliers - largest impact on the economy for each rand spent vs DPWRT lowest Numerous and complex linkages of these departments with other sectors of the economy - these departments may rely on more resources and inputs from other sectors than DPWRT DPWRT had highest impact on job creation responsible for 50% of jobs created 15 of 18
CHALLENGES & RECOMMENDATIONS Classifying local municipalities (rural and urban) was a significant challenge in undertaking the study importance of guidance from National Government, especially Statistics South Africa The project illustrated a clear development gap between urban and rural municipal areas in Mpumalanga the importance of continued & accelerated infrastructure spending in the rural areas of the province interventions in the rural areas (especially CRDP areas) Infrastructure data challenges implementation of IRM must continue and the importance of cross-checking data 16 of 18
CHALLENGES & RECOMMENDATIONS Departments must make sure their infrastructure spending is in line with national & provincial policy regarding rural development (i.e. CRDP) The study s findings must inform Departmental plans & budgets regarding infrastructure spending and rural development the budget is an important tool for growth and development! The importance & relevance of economic impact assessment for policy & budget purposes The importance of future impact studies by Finance and Sector Departments regarding the CRDP areas etc 17 of 18
Thank you 18 of 18