Economic Opportunity & Spatial Mobility in 19th & Early 20th Centuries
Analysis of economic & geographic mobility trends in late 19th & early 20th centuries in Britain, Canada, & the United States. Explore the interplay between economic opportunity and geographic mobility, examining individual & community characteristics associated with mobility. Utilize census data from the US, Canada, & Britain to understand long-term trends and implications of economic inequality.

Download Presentation

Please find below an Image/Link to download the presentation.
The content on the website is provided AS IS for your information and personal use only. It may not be sold, licensed, or shared on other websites without obtaining consent from the author.If you encounter any issues during the download, it is possible that the publisher has removed the file from their server.
You are allowed to download the files provided on this website for personal or commercial use, subject to the condition that they are used lawfully. All files are the property of their respective owners.
The content on the website is provided AS IS for your information and personal use only. It may not be sold, licensed, or shared on other websites without obtaining consent from the author.
E N D
Presentation Transcript
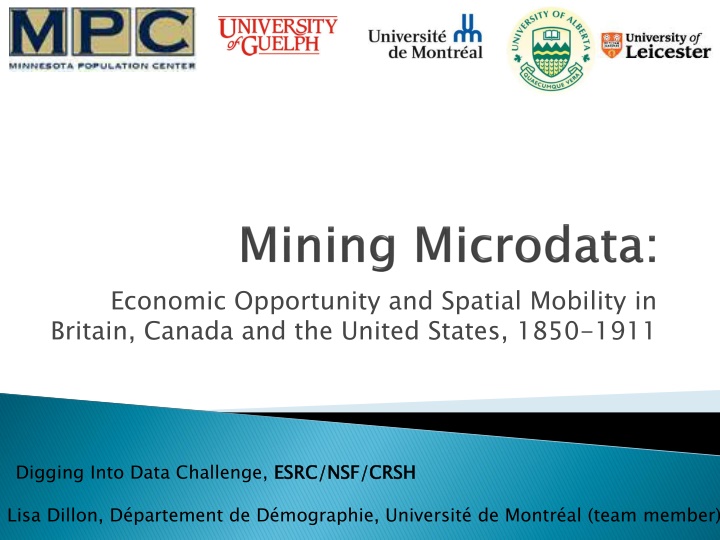
Economic Opportunity and Spatial Mobility in Britain, Canada and the United States, 1850-1911 Digging Into Data Challenge, ESRC/NSF/CRSH ESRC/NSF/CRSH Lisa Dillon, D partement de D mographie, Universit de Montr al (team member)
U.S.: Evan Roberts, Steven Ruggles, John Robert Warren Canada: Kris Inwood, Lisa Dillon, Peter Baskerville UK: Kevin Sch rer Interdisciplinary team: history, economics, demography, sociology, computer science
19th c theorists: NA : economic mobility 1915: richest 1% in U.S. 18% income (similar to Canada & Britain) Today: 24% (higher than Canada & Britain) Severe consequences Insufficient public reaction Historic evolution of this gap insufficiently understood Need long-term comparisons to situate economic opportunity in context
What were the relative levels of economic and geographic mobility in Britain, Canada, and the United States in the late 19th& early 20th centuries? What were the mobility trends in each country? How were economic opportunity and geographic mobility interrelated in each country? What individual and community characteristics were associated with economic and geographic mobility? 1. 2. 3. 4. Men Men only only!
19th & early 20th C censuses from U.S., Canada and Britain 80 million+ cases of complete-count data currently available for 1880/1 Another 93 million to come Samples 1850/1 & 1910/1 Occupation, status Record linkage of 2 sets of panels: 1850/1 to 1880/1 (linkage, analysis underway) 1880/1 to 1910/11 (linkage begun) Comparing occupations of fathers and sons Occupation, relationship status, , birthplace relationship to birthplace to head head, , age age, , sex sex, marital , marital
1852 Census of Canada: Alec Shearer 41 Farmer (log house) 1881 Census of Canada: son Adam 36 Labourer
3 working meetings in 2012/2013 (Guelph & Leicester) Due to scale: automatic record linkage Using training data (manually-linked data) to feed support vector machines, which build a model to predict whether subsequent pairs are a match (confidence score) One to one matches accepted (minimize false links) Procedures designed to maximize the representativeness of linked cases & accuracy of links Linking on characteristics which do NOT change over time (to reduce selection bias) Relatively small panels 3,000 linked men for each country (e.g. 20% of Canadian men aged 0 to 15 in 1852 linked: 2,239)
Example: Occupation of Son in 1881 Canada Product ion transpo rt Farmers, fishermen hunters Admin, Manager Clerical Non-occ, missing Occ of Father in 1852 Professional, technical and related workers Clerical and related workers Sales Workers Service Workers Farmers, fishermen, hunters etc Production & related workers & transport Labourers Non-occupation, missing or ambiguous responses Prof l Sales Service Labourer 0.20% 0.10% 0.10% 0.20% 0.10% 0.10% 0.10% 0.20% 0.10% 0.10% 0.30% 0.10% 0.10% 0.30% 0.10% 0.20% 0.10% 0.30% 0.10% 0.40% 0.20% 0.20% 0.10% 2.00% 0.50% 0.70% 3.00% 1.00% 43.30% 9.90% 5.20% 3.00% 0.60% 0.10% 0.20% 0.30% 0.10% 1.30% 0.60% 0.30% 0.20% 3.80% 3.90% 3.20% 2.30% 1.20% 2.90% 0.30% 0.70% 0.20% 3.40% 0.20% 1.00% 0.30% 1.80% 0.50% 5.90% 0.10% 1.70% 2.80% 54.40% 17.20% 10.00% better worse same 1.20% 0.60% 0.20% 4.60% 24% 21% 50% 25% have moved out of farming, while 11% have moved into farming
For example 1. French Canadian name homogeneity 2. Lower literacy of French Canadians 3. 1852 Canada: birthplace ambiguities ( Canada Canada B = Canada bas or Canada British) 1851 Britain: birthplace highly specific Result: fewer one-to-one links in Canada SSHA Chicago Nov 2013 & ESSHC Vienna April 2014
Big data philanthropy! Different goals for the creation of population data: Genealogists: maximum inclusion of subjects, not necessarily variables (indexes); maximize links Academics: maximize representativity of the linked panels Finessing data usage agreements to make data available to all social scientists Consolidate partnerships for future www.napp.data.org


")
")