Economic Performance Highlights Q4 2014 and GDP Insights
Explore the economic performance data for selected countries in Q4 2014, including GDP highlights and sectoral breakdowns. Gain insights into GDP values and changes in various economic activities.

Download Presentation

Please find below an Image/Link to download the presentation.
The content on the website is provided AS IS for your information and personal use only. It may not be sold, licensed, or shared on other websites without obtaining consent from the author. If you encounter any issues during the download, it is possible that the publisher has removed the file from their server.
You are allowed to download the files provided on this website for personal or commercial use, subject to the condition that they are used lawfully. All files are the property of their respective owners.
The content on the website is provided AS IS for your information and personal use only. It may not be sold, licensed, or shared on other websites without obtaining consent from the author.
E N D
Presentation Transcript
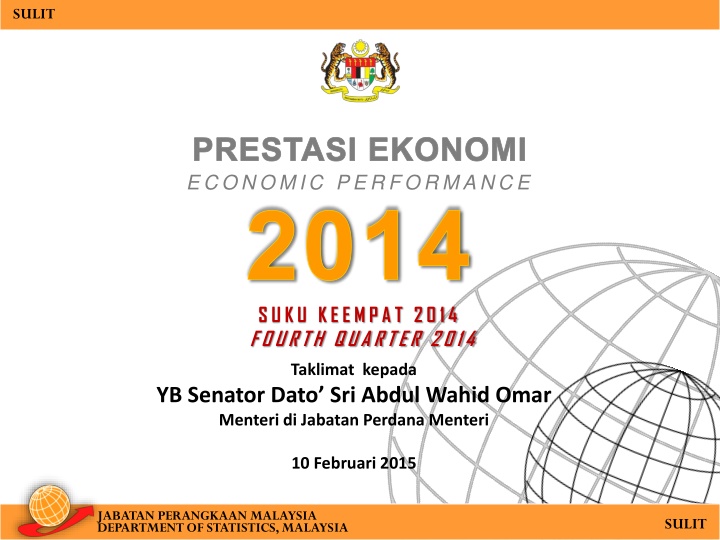
SULIT PRESTASI EKONOMI ECONOMIC PERFORMANCE 2014 SUKU KEEMPAT 2014 FOURTH QUARTER 2014 Taklimat kepada YB Senator Dato Sri Abdul Wahid Omar Menteri di Jabatan Perdana Menteri 10 Februari 2015 JABATAN PERANGKAAN MALAYSIA DEPARTMENT OF STATISTICS, MALAYSIA SULIT
SULIT Selected Countries Performance Q4 2014 7.3% Q3 2014 7.3% 6.9% 5.8% 5.6% 5.3% 5.0% 4.9% 3.6% 3.2% 3.2% 2.8% 2.7% 2.7% 2.7% 2.5% 2.6% 1.5% United States United Kingdom South Korea Taiwan Singapore PR China Indonesia Philippines Malaysia 2013 2014 2013 2014 Country Q1 Q2 Q3 Annual change (%) 2.3 3.1 1.7 2.7 2.2 2.3 3.4 3.7 1.5 3.4 5.0 4.9 7.8 7.7 3.0 2.9 5.5 5.6 7.0 6.3 5.0 5.1 Q4 Q1 Q2 Q3 Q4 United States United Kingdom Japan South Korea Taiwan Singapore PR China Hong Kong Indonesia Philippines Malaysia 1.7 0.8 0.5 2.1 1.4 1.5 7.7 2.9 5.6 7.7 4.2 1.8 1.7 1.4 2.7 2.6 4.0 7.5 3.0 5.6 7.9 4.5 1.9 2.4 2.5 3.9 3.4 4.8 7.4 2.6 5.1 5.6 6.2 2.6 2.6 -0.3 3.5 3.9 2.3 7.5 1.8 5.0 6.4 6.5 2.7 2.6 -1.3 3.2 3.6 2.8 7.3 2.7 4.9 5.3 5.6 2.5 2.7 2.2 1.7 1.6 3.0 2.2 3.9 7.7 2.9 5.6 7.2 4.7 2.4 2.6 n.a. 3.3 3.5 2.8 7.4 n.a. 5.0 6.1 6.0 16thFeb 2.7 3.2 1.5 7.3 25thFeb 5.0 6.9 5.8 JABATAN PERANGKAAN MALAYSIA DEPARTMENT OF STATISTICS, MALAYSIA |2 SULIT
SULIT GDP Highlights In 2014, GDP reached a value of GDPCurrent RM1,070.0 billion RM835.0 billion GDPConstant GNICurrent RM1,032.6 billion 2014 2013 34,123 2012 31,843 2011 30,698 29,713 2010 26,969 JABATAN PERANGKAAN MALAYSIA DEPARTMENT OF STATISTICS, MALAYSIA |3 SULIT
SULIT PRODUCTION SIDE GDP Constant Value 2013 2014 RM 218.7 billion Composition of GDP Kind of Economic Activity 2013 2014 Q3 Q4 Q1 Q2 Q3 Q4 Annual change (%) Agriculture 6.4% Services 55.9% 5.0 5.1 6.2 6.5 5.6 5.8 4.7 6.0 GDP Mining & Quarrying 8.1% 6.0 6.4 6.6 6.2 6.2 5.9 6.3 6.4 Services 4.3 5.2 6.8 7.3 5.4 3.5 6.2 5.2 Manufacturing Mining & Quarrying 1.4 -1.2 -0.8 2.1 1.4 9.6 0.7 3.1 Manufacturing 24.4% 10.2 9.8 18.9 9.9 9.6 10.9 11.6 8.7 Construction 2.1 2.6 2.0 0.2 2.3 7.1 4.0 -2.8 Agriculture Construction 3.9% Note: Excludes Import Duties JABATAN PERANGKAAN MALAYSIA DEPARTMENT OF STATISTICS, MALAYSIA |4 SULIT
SULIT Services improved. . . 2013 2014 GVA Constant Value Kind of Economic Activity 2013 2014 RM 122.3 billion Q3 Q4 Q1 Q2 Q3 Q4 Annual change (%) Composition of Services Sector 6.0 6.4 6.6 6.2 6.2 5.9 6.3 6.4 TOTAL SERVICES Wholesale & Retail Trade Government Services 15.6% 6.4 8.8 6.1 8.4 8.6 9.2 8.2 9.3 Wholesale & Retail Trade 27.4% 10.0 9.9 10.8 10.3 10.2 9.8 9.7 9.8 Communication Utilities & Other Services 12.9% 8.5 8.7 9.3 9.4 9.8 8.1 7.8 9.1 Business Services Transport & Storage Finance & Insurance Accommodation & Restaurants 4.6 5.0 5.1 5.4 4.8 4.6 4.9 5.8 Real Estate & Business Services 10.0% 1.8 2.0 0.9 0.5 2.4 0.7 2.6 2.0 5.7 6.2 5.8 5.8 6.1 5.6 5.7 7.2 4.1 3.5 3.9 4.4 3.2 2.7 4.4 3.7 Utilities Accommodation & Restaurants 4.5% 4.7 5.6 5.3 5.4 5.5 5.4 5.5 5.7 Real Estate Finance & Insurance 15.7% 5.1 4.9 5.0 5.1 4.8 4.5 5.0 5.1 Other Services Communication, Transport & Storage 13.9% 8.3 6.5 9.6 8.6 8.1 7.3 6.2 4.8 Gov. Services JABATAN PERANGKAAN MALAYSIA DEPARTMENT OF STATISTICS, MALAYSIA |5 SULIT
SULIT Manufacturing sustained . . . 2013 2014 GVA Constant Value RM 53.4 billion 2013 2014 Kind of Economic Activity Q3 Q4 Q1 Q2 Q3 Q4 Annual change (%) Composition of Manufacturing Sector TOTAL MANUFACTURING Electrical & Electronic Products Petroleum, Chemical, Rubber & Plastic Products Food, Beverages & Tobacco Wood Products, Furniture, Paper Products, Printing & Publishing Non-Metallic Mineral Products, Basic Metal & Fabricated Metal Products 4.3 5.2 6.8 7.3 5.4 3.5 6.2 5.2 Electrical & Electronic products 24.8% 3.5 10.3 3.7 9.8 11.9 11.6 8.0 9.6 Non-Metallic Mineral products, Basic Metal & Fabricated Metal products 12.1% 5.9 1.4 3.1 -1.4 1.2 2.0 1.8 4.4 Transport Equipment & Other Manufactures 16.3% 10.9 8.4 0.4 7.3 0.4 -0.6 4.0 5.4 -0.6 6.3 -2.4 0.6 2.9 6.7 7.9 7.7 Food, Beverages & Tobacco 10.4% 1.3 3.7 3.9 5.2 3.0 4.0 0.8 3.2 Transport Equipment & Other Manufactures 11.7 Textiles, Wearing Apparel & Leather Products 8.7 12.2 14.5 12.1 18.2 6.3 0.9 Textiles, Wearing Apparel & Leather products 1.7% Petroleum, Chemical, Rubber & Plastic products 28.9% Wood products, Furniture, Paper products, Printing & Publishing 5.8% -0.5 10.4 6.8 2.2 11.1 15.6 14.3 7.2 JABATAN PERANGKAAN MALAYSIA DEPARTMENT OF STATISTICS, MALAYSIA |6 SULIT
SULIT Mining & Quarrying posted a robust growth. . . GVA Constant Value 2013 2014 RM 17.8 billion 2013 2014 Kind of Economic Activity Q3 Q4 Q1 Q2 Q3 Q4 Composition of Mining & Quarrying Sector Annual change (%) Other Mining & Quarrying 1.6% TOTAL MINING & QUARRYING 0.7 3.1 1.4 -1.2 -0.8 2.1 1.4 9.6 Natural Gas 45.2% Crude Petroleum & Condensate -1.8 -5.5 -3.7 1.9 3.2 -2.8 4.3 15.9 4.9 3.4 1.9 2.0 -0.8 4.4 1.6 3.1 Natural Gas Crude Petroleum & Condensate 53.2% 10.9 8.8 9.0 11.0 11.5 7.6 8.7 7.5 Other Mining JABATAN PERANGKAAN MALAYSIA DEPARTMENT OF STATISTICS, MALAYSIA |7 SULIT
SULIT Construction grew... GVA Constant Value RM 8.5 billion 2013 2014 2013 2014 Kind of Economic Activity Q4 Q1 Q2 Q3 Q4 Q3 Composition of Construction Sector Annual change (%) Residential 29.5% TOTAL CONSTRUCTION10.9 11.6 10.2 9.8 18.9 9.9 9.6 8.7 Non Residential 27.4% 8.1 15.2 16.4 11.7 7.9 17.1 5.5 13.2 Non Residential 21.3 15.6 29.7 15.5 18.6 17.1 19.2 14.9 Residential 8.8 9.0 27.4 10.1 8.5 9.0 13.2 8.6 Special Trade Civil Civil Engineering Engineering 25.8% Special Trade 17.3% 4.4 1.3 8.6 3.9 4.2 11.4 3.2 -4.3 JABATAN PERANGKAAN MALAYSIA DEPARTMENT OF STATISTICS, MALAYSIA |8 SULIT
SULIT Agriculture declined. . . GVA Constant Value 2013 2014 RM 14.0 billion Kind of Economic Activity 2013 2014 Q3 Q4 Q1 Q2 Q3 Q4 Composition of Agriculture Sector Annual change (%) TOTAL AGRICULTURE Forestry & Logging 10.0% 2.1 2.6 2.0 0.2 2.3 7.1 4.0 -2.8 Fishing 13.7% -0.6 -1.2 1.6 14.9 5.2 2.6 2.4 -8.9 Oil Palm Rubber 5.2% -0.1 -14.4 -12.1 -15.0 -24.1 -25.5 -10.1 -19.2 Rubber Other Agriculture 18.5% Forestry & Logging -7.8 2.8 -6.9 -0.5 -0.8 5.9 3.2 2.7 1.6 2.1 1.6 -3.3 2.1 0.4 3.0 2.6 Fishing Other Agriculture 8.1 7.0 8.1 8.2 7.8 6.8 10.7 4.9 Oil Palm 38.5% Livestock 14.0% 6.1 7.7 9.4 7.7 11.7 10.6 7.9 8.9 Livestock JABATAN PERANGKAAN MALAYSIA DEPARTMENT OF STATISTICS, MALAYSIA |9 SULIT
SULIT EXPENDITURE SIDE 2013 2014 GDP(E) Constant Value 2013 2014 RM 218.7 billion Type of Expenditure Q3 Q4 Q1 Q2 Q3 Q4 Annual change (%) 4.7 6.0 5.0 5.1 6.2 6.5 5.6 5.8 GDP Composition of GDP Private Final Consumption 8.0 7.4 7.1 6.5 7.2 7.1 6.7 7.8 Private Final Consumption 51.6% Gross Fixed Capital Formation 26.3% Gross Fixed Capital Formation 8.5 4.7 9.4 6.5 6.3 7.2 1.1 4.3 Government Final Consumption 7.8 5.2 12.3 -0.5 6.3 4.4 5.3 2.7 0.6 5.1 4.6 5.7 7.9 8.8 2.8 1.5 Exports Net Exports 6.9% 2.0 3.9 4.2 7.1 7.1 3.9 2.2 2.6 Imports Government Final Consumption 16.7% -12.6 19.7 9.9 -6.8 14.9 91.0 11.4 -9.8 Net Exports Note: Exclude Changes in Inventories, Valuables & Statistical Discrepancy JABATAN PERANGKAAN MALAYSIA DEPARTMENT OF STATISTICS, MALAYSIA |10 SULIT
SULIT Private Final Consumption Expenditure picked-up... PFCE Constant Value 2013 2014 2013 2014 RM 112.9 billion Composition of PFCE Type of Expenditure Q3 Q4 Q1 Q2 Q3 Q4 Annual change (%) TOTAL PRIVATE FINAL CONSUMPTION 8.0 7.4 7.1 6.5 6.7 7.2 7.1 7.8 Others 12.1% Transport & Communication 22.4% Food & Non- Alcoholic Beverages 7.3 7.4 7.1 6.7 6.2 7.4 6.6 6.5 Miscellaneous goods and services 14.2% 10.0 11.5 11.8 12.0 9.7 10.5 10.8 9.8 Communication Housing, Water, Electricity 6.3 6.3 6.1 6.2 5.7 6.5 5.8 5.3 Miscellaneous Goods & Services 5.8 6.1 8.1 6.0 6.1 6.6 6.3 5.4 Recreation 7.5% Food & Non-Alcoholic Beverages 18.9% 7.1 5.1 5.4 7.9 4.3 6.9 5.6 5.4 Transport Restaurants & Hotels 9.6% Restaurants & Hotels 7.2 8.4 8.0 7.5 6.0 7.5 7.0 6.6 Housing, Water, Electricity, Gas & Other Fuels 15.3% 11.7 10.8 11.0 11.2 8.0 11.2 8.9 6.1 Recreation 3.7 8.4 13.3 7.5 2.1 -1.8 10.6 21.2 Others JABATAN PERANGKAAN MALAYSIA DEPARTMENT OF STATISTICS, MALAYSIA |11 SULIT
SULIT GFCF stepped-up. . . 2013 2014 VALUE at current prices (RM BILLION) 2013 2014 Q3 Q4 Q1 Q2 Q3 Q4 GFCF Public vsPrivate TOTAL GFCF* 265.0 282.6 68.1 66.8 66.8 74.5 70.2 71.1 Public 104.6 101.1 24.8 34.5 22.3 21.4 23.0 34.4 (%) Private 160.5 181.5 43.3 32.4 44.4 53.1 47.2 36.8 25.8 30.0 23.3 22.8 25.0 19.0 18.4 2013 2014 SHARE (%) At constant 2005 prices 16.6 20.0 25.7 (%) 15.6 14.1 2013 2014 12.1 19.3 Q3 Q4 Q1 Q2 Q3 Q4 11.1 11.2 15.0 33.0 (%) 6.8 10.0 33.0 28.0 Public 39.6 35.9 36.5 51.7 33.5 28.9 32.9 48.6 10.0 10.2 5.0 28.0 23.0 6.1 Private 60.4 64.1 63.5 48.3 66.5 71.1 67.1 51.4 0.0 23.0 18.0 Q112 Q212 Q312 Q412 Q113 Q213 Q313 Q413 Q114 Q214 Q314 Q414 -5.0 -2.1 2013 2014 -0.1 GROWTH YoY (%) at constant 2005 prices -1.4 18.0 -3.8 13.0 -3.3 -10.0 -8.9 -6.4 13.0 2013 2014 8.0 -15.0 Q3 Q4 Q1 Q2 Q3 Q4 8.0 3.0 3.0 -2.0 Q112 Q212 Q312 Q412 Q113 Q213 Quarter TOTAL GFCF 8.5 4.7 9.4 6.5 6.3 7.2 1.1 4.3 Public GFCF growth Private GFCF growth Private GFCF Public GFCF Q412 Private GFCF Q113 -2.0 Q112 Q212 Q312 Q213 Quarter Public 2.2 -4.9 -0.1 -1.4 -6.4 -3.3 -8.9 -2.1 Public GFCF Private 13.1 11.0 15.6 16.6 14.1 12.1 6.8 11.2 * The sum of components may not add up to total due to rounding JABATAN PERANGKAAN MALAYSIA DEPARTMENT OF STATISTICS, MALAYSIA |12 SULIT
SULIT Seasonal Adjustment Rate of change : Quarter on Quarter % 8.0 6.0 3.6 4.0 3.0 3.2 2.0 2.0 0.9 IV 1.9 II 0.0 I II III IV I II III IV I II III IV I II III IV I II III IV I II III IV I III -2.0 2008 2009 2010 2011 2012 2013 2014 -4.0 -6.0 -8.0 Non Seasonally Adjusted Seasonally Adjusted 2008 2009 2010 2011 2012 2013 2014 GDP Q1 Q2 Q3 Q4 Q1 Q2 Q3 Q4 Q1 Q2 Q3 Q4 Q1 Q2 Q3 Q4 Q1 Q2 Q3 Q4 Q1 Q2 Q3 Q4 Q1 Q2 Q3 Q4 Non Seasonally Adjusted 2.1 -2.5 2.5 3.7 1.7 -2.8 3.0 3.3 2.9 -4.8 3.3 3.8 3.0 -3.9 3.6 3.0 3.2 -1.9 2.0 3.2 -2.8 -7.9 4.2 6.0 2.6 -2.7 3.3 2.3 Seasonally Adjusted 2.4 0.5 -0.2 -2.5 -3.5 2.5 2.8 2.8 1.7 1.6 -0.5 2.0 1.8 1.0 1.3 1.1 1.7 1.4 1.1 2.0 -0.3 1.6 1.7 1.9 0.9 1.9 0.9 2.0 Seasonally Adjusted Annualise Rate 7.4 3.9 5.3 4.3 6.9 5.7 4.6 8.1 -1.2 6.8 7.1 7.6 3.5 7.8 3.8 8.4 9.9 1.9 -0.7 -9.7 -13.410.4 11.7 11.5 6.9 6.7 -1.8 8.2 Thank You JABATAN PERANGKAAN MALAYSIA DEPARTMENT OF STATISTICS, MALAYSIA |13 SULIT
SULIT |14 SULIT
BALANCE OF PAYMENTS SULIT RM Mil CAB/GDP 25,000 10.0% 20,000 8.0% CAB recorded a lower surplus of RM6.1 bil (2.2% of GDP) mainly due to higher net outlay in primary income account. 7.7% 15,000 5.6% 6.1% 6.0% 10,000 7,593 5.6% 6,070 4.0% 3,955 5,000 4.0% 0.8% 2.2% 2.8% 2.0% 0 Q113r Q213r Q313r Q413r Q114p Q214p Q314p Q414p -5,000 0.0% -10,000 -2.0% -15,000 -13,047 -4.0% -20,000 -6.0% -25,000 FA and Reserve Assets recorded net outflows of RM13.0 bil due to higher outflow in portfolio investment. -30,000 -8.0% CAB FINANCIAL ACCOUNT & RESERVE ASSETS % CAB/GDP Year CAB (RM Bil.) FA RESERVE ASSET (RM Bil.) CAB/GDP (%) (RM Bil.) 2013 39.9 -15.8 -14.6 4.0 2014 49.5 -76.5 36.3 4.6 JABATAN PERANGKAAN MALAYSIA DEPARTMENT OF STATISTICS, MALAYSIA |15 SULIT
DIRECT INVESTMENT BY SECTOR, Q414 SULIT Others DIA Q4 2014 -RM 10,393 Million 1,105 -941 Agriculture Transportation and Storage -1,029 Mining & Quarrying -1,256 -1,352 Real Estate -1,419 Information and Communication Financial and Insurance -5,501 -6,000 -5,000 -4,000 -3,000 -2,000 -1,000 0 1,000 2,000 RM Million Others -698 FDI Q4 2014 RM 10,184 Million Administrative 169 Real Estate 271 Information and Communication 987 Mining & Quarrying 2,924 Financial and Insurance 3,215 Manufacturing 3,317 -1,000 -500 0 500 1,000 1,500 2,000 2,500 3,000 3,500 4,000 RM Million |16 SULIT
DIA & FDI BY SECTOR, 2013 & 2014 SULIT Others 489 558 Others FDI 2014 RM 35,085 Million DIA 2014 -1,984 Transportation and Storage -RM 52,186 Million 860 Construction Agriculture -2,109 Real Estate Activities 2,738 Real Estate -3,204 3,736 Manufacturing WholesSale & Retail Trade 4,719 -8,156 Information and Communication Financial and Insurance 9,950 -13,224 Financial and Insurance Mining & Quarrying 12,524 -23,997 Mining & Quarrying 500 1,500 2,500 3,500 4,500 5,500 6,500 7,500 8,500 9,50010,50011,50012,500 -30,000 -25,000 -20,000 -15,000 -10,000 -5,000 0 5,000 RM Million RM Million 3,049 Others 920 others DIA 2013 FDI 2013 RM 38,238 Million -RM 43,689 Million 1,002 Agriculture Real Estate -1,299 2,476 Information and Communication Arts, Entertainment and Recreation Info. & Comm. -3,169 2,705 Financial and Insurance Manufacturing -3,185 3,498 Real Estate Information and Communication -3,671 11,240 Mining & Quarrying Financial and Insurance -8,927 14,269 Manufacturing Mining & Quarrying -24,359 0 2,000 4,000 6,000 8,000 10,000 12,000 14,000 -30,000 -25,000 -20,000 -15,000 -10,000 -5,000 0 5,000 RM Million RM Million |17 SULIT
SULIT THANK YOU |18 SULIT