Economics of Immigration Insights
Explore the intricate details of immigration economics presented at the Rotary Club of Watsonville. Learn about historical trends, authorized immigration data, and the esteemed contributors behind the research. Delve into the economic principles shaping policy issues in the United States.
Download Presentation

Please find below an Image/Link to download the presentation.
The content on the website is provided AS IS for your information and personal use only. It may not be sold, licensed, or shared on other websites without obtaining consent from the author. If you encounter any issues during the download, it is possible that the publisher has removed the file from their server.
You are allowed to download the files provided on this website for personal or commercial use, subject to the condition that they are used lawfully. All files are the property of their respective owners.
The content on the website is provided AS IS for your information and personal use only. It may not be sold, licensed, or shared on other websites without obtaining consent from the author.
E N D
Presentation Transcript
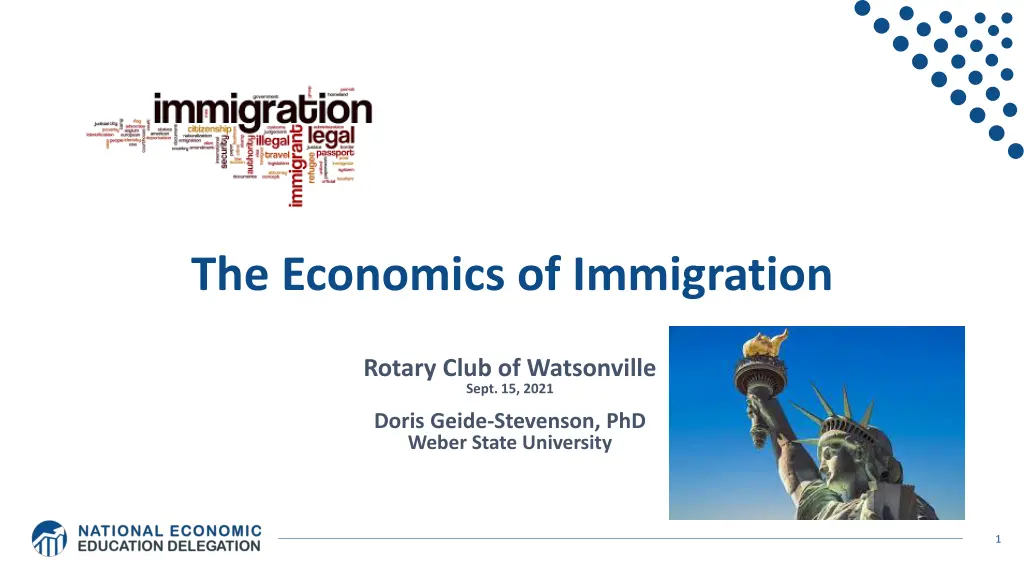
The Economics of Immigration Rotary Club of Watsonville Sept. 15, 2021 Doris Geide-Stevenson, PhD Weber State University 1
National Economic Education Delegation Vision - One day, the public discussion of policy issues will be grounded in an accurate perception of the underlying economic principles and data. Mission - NEED unites the skills and knowledge of a vast network of professional economists to promote understanding of the economics of policy issues in the United States. NEED Presentations - Are nonpartisan and intended to reflect the consensus of the economics profession. 2
Who Are We? Honorary Board: 52 members - 2 Fed chairs: Janet Yellen, Ben Bernanke - 6 chairs of the Council of Economic Advisers o Furman (D), Rosen (R), Bernanke (R), Yellen (D), Tyson (D), Goolsbee (D) - 3 Nobel prize winners o Akerlof, Smith, Maskin Delegates: 520+ members - At all levels of academia and some in government service - All have a PhD in economics - Crowdsource slide decks - Give presentations Global Partners: 45 PhD Economists - Aid in slide deck development 3
Credits and Disclaimer This slide deck was authored by: - Anna Maria Mayda, Georgetown University - Robert Gitter, Ohio Wesleyan University - Roger White, Whittier College This slide deck was reviewed by: - Kirk Doran, Notre Dame - Ethan Lewis, Dartmouth College Disclaimer - NEED presentations are designed to be nonpartisan. - It is, however, inevitable that presenters will be asked for and will provide their own views. - Such views are those of the presenter and not necessarily those of the National Economic Education Delegation (NEED). 4
Outline History/Data of immigration to the US Economics of immigration
Historical Trends in Authorized Immigration 6 https://www.libertyellisfoundation.org/immigration-timeline
Number of Immigrants and their Share of the total U.S. Population, 1850 -2019 https://www.migrationpolicy.org/programs/data-hub/us- immigration-trends#history 8
Immigrant Population in 2017 Categories of the total number of immigrants in the United States. 9 https://www.pewresearch.org/fact-tank/2019/07/12/how-pew-research-center-counts-unauthorized-immigrants-in-us/
U.S. Unauthorized Immigration: Labor Force 10 Pew Research Center, 5 facts about illegal immigration in the U.S., June 12, 2019
Unauthorized Immigration: 2012-2016 12 https://www.migrationpolicy.org/programs/data-hub/charts/unauthorized-immigrant-populations-country-and-region-top-state-and-county
Why Do We Care? Economic Implications GDP Labor markets Government revenue and spending Crime 13
GDP: How Does This Work? What determines the size of an economy? - Technology/productivity - Physical capital - The number of workers o Immigration adds to the number of workers. Number of immigrants in the labor force is high - 28.2 million foreign-born persons ages 16+ in the labor force in 2018. - 17.4% of the total US workforce (little less than 5% unauthorized) Evidence - Immigrants added 11% to GDP ($2 trillion) in 2016. 14
Labor Market Implications: Complicated Depends on the type of immigrant: Skills/education - Similar to native-born population? - Immigration surplus? - Low-skilled? - increases immigration surplus - Highly skilled? increases immigration surplus In the long-run: Brings capital market implications - Expansion of capital stock through increased investments in equipment etc. 15 Source: Hong & McLaren (2015).
Labor Market Implications: General Principles Short run - Harm likely to native-born workers who are similar to immigrants. - Benefit likely for other workers and owners of capital. Long run - Expanded opportunities may restore wages of harmed native-born workers. - Lower prices in some areas will restore purchasing-power of harmed workers and others. - Inflows of other types of labor and capital may return the economy to its pre- immigration wage structure and production patterns, but may also increase overall productivity. Note: Repeated short run shocks can make the medium and long run look like the short run. 16
CConsensus among Economists 97% of economists agree or agree with provisos that immigration generally has a net positive economic effect for the US economy. 64% of economists disagree with the statement that easing restrictions on immigration will depress the average wage rate in the US. Geide-Stevenson, LaParraPerez, (2021) 17
Labor Market Implications: The Surplus The Surplus - Immigration CAN make all native-born workers and capital more productive. - This increases incomes of the native born. - In other words, the economy might not just get bigger, it might become more productive as well! - This will, on average, increase the living standards of all native-born workers and owners of capital. 18
Labor Market Implications: Evidence of Surplus Surplus: % of GDP Type of Immigrants Short Run Long Run No Skill Bias 0.24 to 0.50 0.02 to 0.03 Low skilled 0.45 to 0.90 0.42 to 0.77 Highly skilled 0.75 to 1.35 0.16 to 0.31 19 Source: Borjas (2014a).
Skilled Immigrants and Innovation 1% increase in the share of the immigrant college graduate population - 9-18% increase in patenting per capita - Increased immigration increases patenting by native-born population - Nonetheless, the effect is positive In the 1990s - Increased skilled immigration can account for one-third of increased patenting in that decade. - This translates into a 1.4-2.5% increase in GDP per capita by the end of the decade. 21
Immigrants and Entrepreneurship Self-Employment Rates by Nativity 22 Source: Magnus Lofstrom from Current Population Survey Data.
Fortune 500: First- and Second-Generation Founders 24
Government Revenues versus Expenditures Basic Question: - What are the taxes (income, sales, and other) immigrants pay vs. government expenditures on public benefits and services they receive. More complicated: - Immigrants also affect the fiscal equation for many native-born residents. o Indirectly through labor and capital markets. o Changes in wages and the return to capital. 25
What Do We Know? Immigrants who arrive while of working age: - Are, on average, net contributors. - 21-year-old with a high school diploma: +$126,000 over a lifetime o Though this value gradually declines with age at arrival. o Turns negative for arrivals of age 35+ Net contribution crucially depends on characteristics - Age distribution, family composition, health status, fertility patterns - Temporary or permanent relocation - Employment in the legal labor market - Authorized or unauthorized 26
Implications for Major Federal Programs Documented immigrants are less likely to use Social Security and Medicare. Unauthorized immigrants are ineligible. - They may pay into the system but cannot receive benefits. Medicaid: not available to legal residents for the first five years. Provide a source of revenue for an aging population. 27
Implications for Social Security Population Age 65+ per 100 of Working Age (25-64) 28 Source: Blau & Mackie (2017).
Bottom Line/Consensus of Estimates Federal level: fiscal impact is generally positive. State and local level: typically negative fiscal impact. 29
Immigrants and Crime Rates Conventional wisdom: - Immigrants commit crimes more frequently than do native born residents. - Rising immigration leads to rising crime. What do the data say? - Rates of incarceration are lower for the foreign born than US born. - Neighborhoods with more immigrants have lower crime rates. - There is no evidence that deporting noncitizen immigrants affects crime rates. 30
Crime: Incarceration Rates in California 31 Source: Butcher & Piehl (2008).
Summary Immigration should be thought of as increasing the population of the United States. This brings economic growth and opportunity, just as does increasing the native-born population. Including unauthorized immigrants, the supply of low-skilled workers is increased - This lowers the wages of low-skilled workers. - But also increases labor force participation among highly skilled workers. 32
Thank you! Any Questions? www.NEEDelegation.org <presenter name> <presenter email> Contact NEED: info@needelegation.org Submit a testimonial: www.NEEDelegation.org/testimonials.php Become a Friend of NEED: www.NEEDelegation.org/friend.php 33
Available NEED Topics Include: US Economy Trade Wars Economic Inequality Housing Policy Climate Change Federal Budgets US Social Policy Federal Debt Trade and Globalization 2017 Tax Law Economic Mobility Autonomous Vehicles 34


