Learn how to present data effectively in research reports using tables, graphs, and charts. Explore techniques for labeling visuals, numbering figures, and creating concise captions. Enhance your data analysis skills and improve the clarity and impact of your findings and discussions.
Please find below an Image/Link to download the presentation.
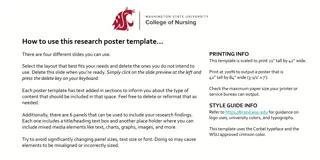
The content on the website is provided AS IS for your information and personal use only. It may not be sold, licensed, or shared on other websites without obtaining consent from the author. If you encounter any issues during the download, it is possible that the publisher has removed the file from their server.
You are allowed to download the files provided on this website for personal or commercial use, subject to the condition that they are used lawfully. All files are the property of their respective owners.
The content on the website is provided AS IS for your information and personal use only. It may not be sold, licensed, or shared on other websites without obtaining consent from the author.
DATA ANALYSIS (Coding System) Example: Gender of the respondents 1 for Male and 2 for Female. Type of HP service plan used 1 pre-paid , 2 fixed line Type of HP provider used 1 TalkTime , 2 AirCom , 3 LemonRing Reasons of choosing the provider 1 low price , 2 popular service , 3 better coverage Sample (Page 48 & 49)
Coding System Code for the students who took part in the survey, i.e. S1, S2, etc. Also suitable for Yes/No questions and Likert- scale statements in a questionnaire. 1 Yes and 2 No 1 strongly agree , 2 agree , 3 disagree and 4 strongly disagree Page 49
Presenting Quantitative Data Turn the data into something more comprehensible. Use illustrations such as tables, graphs and charts. Use appropriate illustrations to help readers to understand the data, to identify the significant features of the data and grasp the significance of the entire report.
Figure or Table Number Figures are visuals consisting of graphs, maps, schematic diagrams, photographs, flowcharts, Gantt charts, tree diagrams, etc. Use Arabic numerals, e.g. Figure 2 instead of Figure Two . Number the figures and tables separately. Number the visuals in their sequential order of appearance.
Title or Caption Should be short and concise. Titles of visuals should describe the subject of the illustrations and data included. Titles should be placed correctly, i.e. title of a table should be placed above the table while title for a figure should be placed below the figure. First letter of every word in the title should be capitalised except for prepositions and articles.
Analysing Quantitative Data Analysis of quantitative data involves interpretation of frequencies, tables, graphs, etc. that describes the data. Table 4.5 Number of Students According to HP Service Plan N = 14 Type of HP Service Plan Number of Students Pre-paid 8 Fixed Line 6 The analysis of the data in Table 4.5 shows that eight students used the Pre-paid HP service plan and six other students used the Fixed Line HP service plan.
Responses to an Open-ended Question in the Questionnaire Hand phones are very popular among students of all ages. Please give your comments. Student Response Student 1 It can help them get in touch with their loved ones. For example, their parents. It is the trend of today s teenagers. Student 2 Student 3 Many university students use hand phones to call their friends. They also use it to contact their family. Everyone has a hand phone today. So, you will be out of place if you do not have one. I don t want to be left out. I want to have a hand phone that is used by other students. Student 4 Student 5
Figure A shows the causes of road accidents happening in Malaysia (RQ1). The questionnaires were distributed to 30 respondents and all 30 responded. The chart shows that 8 respondents claimed road accidents are mainly caused by human errors or the drivers attitude and 7 respondents blamed it on poor reinforcements . On the other hand a minority (3 respondents) viewed it as due to technical error for example like poor car condition while only 2 respondents feel it was caused by road condition. 1. Explain Statistics/ Presenting statistics
Compare findings with previous research findings However, studies carried out by Smith (2003) in United States revealed road accidents were mainly caused by road condition. Both studies resulted different findings as United States experienced long winter season unlike Malaysia. Besides that differences could also be influenced by the fact that Smith (2003) surveys were responded by the highway patrollers instead road users. Results in any research are expected to be different since accidents are always related to the environment and lifestyle of one s country. Road condition in Malaysia is one of the best in the world. Evaluate the situation Infer ( state your view points )
INDIVIDUAL PRESENTATION 10% ( TASK 2) Oral Presentation Skills Guidelines -PPT Content (Bullet points) Figure/Table/Chart Explanation of the Statistics Comparing with previous research Evaluation of the difference Inference Presentation Skill Voice Projection (Clear Enough) Eye contact Good Body Language Interaction with audience Language Spoken English Language Simple /straight f0rward
Research Question 1 What are the causes or road accidents in UTM? 9 8 8 7 7 1 -Attitude/Human Error 2-Technical Error 3- Road Condition 4- Poor Reinforcements 6 5 4 3 3 2 2 1 0 1 2 3 4 Figure 1 : Causes of road accidents in UTM
EXPLANATION OF STATISTICS 9 Figure A shows the causes of road accidents happening in Malaysia (RQ1). 8 8 7 7 The questionnaires were distributed to 30 respondents and all 30 responded. 6 8 respondents claimed road accidents are mainly caused by human errors or the drivers attitude 5 4 3 7 respondents blamed it on poor reinforcements . 3 2 2 Minority (3 respondents) viewed it as due to technical error for example like poor car condition. 1 2 respondents feel it was caused by road condition. 0 1 2 3 4
COMPARING THE FINDINGS WITH PREVIOUS RESEARCH 9 Studies carried out by Smith (2003) in United States revealed road accidents were mainly caused by road condition. 8 8 7 7 Studies by Parmesan ( 2010 ) in Hong Kong unveiled that road accidents were contributed by the increasing number of population owning cars. 6 5 4 Minister of Transportation in Malaysia recommended Malaysians to utilize public transportation or carpooling in reducing the number or vehicles on roads-reduce accidents. 3 3 2 2 1 0 1 2 3 4
Evaluating the differences between all of the findings 9 All studies resulted different findings 8 8 7 United States experienced long winter season 7 Malaysia is hot all year round. 6 Smith (2003) surveys were responded by the highway patrollers. 5 4 3 Studies in UTM were responded by road users. 3 2 2 Studies in Hong Kong involved a highly dense populated area compared to UTM. 1 0 1 2 3 4
Inference 9 Results in any research are expected to be different since 8 8 7 Road condition in Malaysia Highway is one of the best in the world. 7 6 Accidents are always related to the environment and lifestyle of one s country. 5 4 3 3 2 2 1 0 1 2 3 4