Effective Data Visualization Principles and Examples
Learn about key principles in data visualization such as telling a story, maintaining graphical integrity, and minimizing complexity. Explore examples of charts that illustrate issues with labeling, axis integrity, unnecessary elements, and more, highlighting the importance of clear and efficient visual representation of data.

Download Presentation

Please find below an Image/Link to download the presentation.
The content on the website is provided AS IS for your information and personal use only. It may not be sold, licensed, or shared on other websites without obtaining consent from the author. If you encounter any issues during the download, it is possible that the publisher has removed the file from their server.
You are allowed to download the files provided on this website for personal or commercial use, subject to the condition that they are used lawfully. All files are the property of their respective owners.
The content on the website is provided AS IS for your information and personal use only. It may not be sold, licensed, or shared on other websites without obtaining consent from the author.
E N D
Presentation Transcript
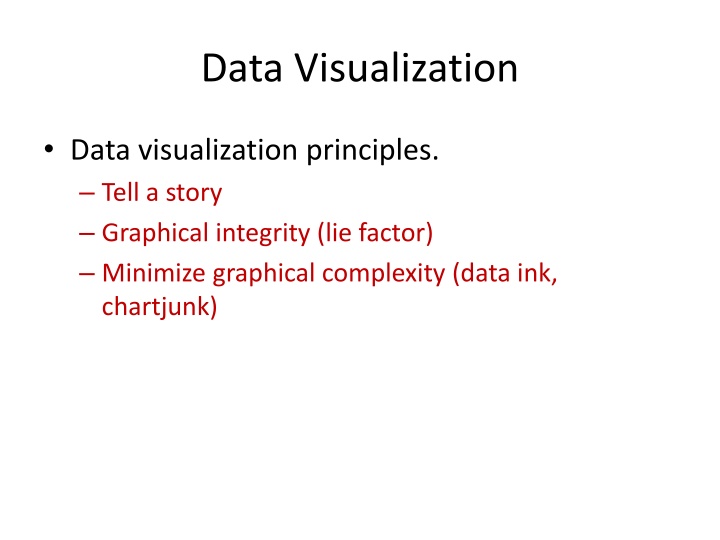
Data Visualization Data visualization principles. Tell a story Graphical integrity (lie factor) Minimize graphical complexity (data ink, chartjunk)
Bonus Assignment Chart #1: Issues: Monthly Sales 150000 140000 Tell a Story The vertical axis isn t labeled. We don t know the unit. 130000 120000 110000 100000 90000 80000 70000 60000 50000 Graphical Integrity The vertical axis does not start from zero Monthly Sales ($) Graphical Complexity Horizontal and vertical lines are unnecessary (Chartjunk) 160000 140000 120000 100000 80000 60000 40000 20000 0
Bonus Assignment Chart #1: Issues: Monthly Sales 150000 140000 Tell a Story The vertical axis isn t labeled. We don t know the unit. 130000 120000 110000 100000 90000 80000 70000 60000 50000 Graphical Integrity The vertical axis does not start from zero Monthly Sales ($) Graphical Complexity Horizontal and vertical lines are unnecessary (Chartjunk) 160000 140000 120000 100000 80000 60000 40000 20000 0 This also works
Bonus Assignment Chart #2: Issues: Quantity Sold by Customer Type Silver 32% Graphical Integrity The 3D chart makes it difficult to compare the sizes Gold 40% Platinum 28% Graphical Complexity The 3D chart requires more ink (Chartjunk) Quantity Sold by Customer Type Silver 32% Gold 40% Platinum 28%
Bonus Assignment Chart #3: Issues: Total Sales by State Tell a Story Vertical axis isn t labeled. We don t know the units Because there are many states to compare, horizontal lines may be helpful 184847 200000 150000 126167 136338 92287 107344 100000 67524 76853 33991 46094 50000 54359 9986 19389 30667 33014 66318 20076 53469 47377 26935 32756 0 AZ CO GA LA MN Total NC OH RI TN VA Graphical Integrity The 3D chart makes it difficult to compare sizes The cone-shaped bars make it even harder to compare sizes Total Sales by State ($) 200000 180000 160000 140000 120000 Graphical Complexity The 3D chart requires more ink (Chartjunk) The number labels are unnecessary 100000 80000 60000 40000 20000 0 GA TN NC NY HI LA PA WA FL MI MO OH RI AZ SC VA CO MN UT CA