Effective GIS Output Design for Enhanced Data Visualization
Understanding the importance of clear and intelligible GIS output is crucial for effective communication of geographical data analysis results. This involves creating visually appealing maps and visualizations that facilitate decision-making processes. GIS provides numerous advantages in terms of interactive data visualization, flexibility in data manipulation, and the ability to create dynamic perspectives. By optimizing map outputs and layouts, users can effectively convey the story behind the data while ensuring clarity, accuracy, and relevance.

Download Presentation

Please find below an Image/Link to download the presentation.
The content on the website is provided AS IS for your information and personal use only. It may not be sold, licensed, or shared on other websites without obtaining consent from the author. If you encounter any issues during the download, it is possible that the publisher has removed the file from their server.
You are allowed to download the files provided on this website for personal or commercial use, subject to the condition that they are used lawfully. All files are the property of their respective owners.
The content on the website is provided AS IS for your information and personal use only. It may not be sold, licensed, or shared on other websites without obtaining consent from the author.
E N D
Presentation Transcript
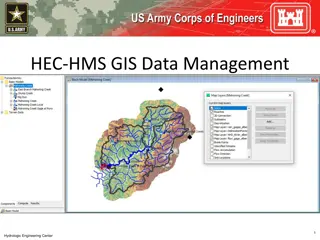
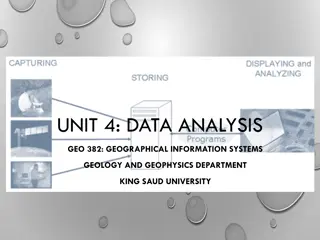
UNIT 5: GIS OUTPUT AND DESIGN GEO 382: GEOGRAPHICAL INFORMATION SYSTEMS GEOLOGY AND GEOPHYSICS DEPARTMENT KING SAUD UNIVERSITY
INTRODUCTION Output is the final product of any analysis. If our output is unintelligible or inadequately communicates the final results of analysis, we have failed in our mission. After all, our purpose is not just to analyze geographical data but also to provide a tool for decision makers. This requires us to effectively and succinctly communicate the results of our analysis.
GIS DATA OUTPUT AND VISULAIZATION Visualizing large amounts of information interactively is one of the most attractive and useful capabilities of GIS. High-powered computers can alter any element of the display "on the fly," changing not only the look of the graphic image but also its interpretation. This ability to create multiple perspectives -- both literally and figuratively -- enhances a viewer's perceptive abilities to understand the phenomenon being studied like never before.
ADVANTAGES OF GIS OUTPUT Visualizing data using current computing technology and interactive GIS has many advantages over doing so using traditional paper maps. The following is a partial list, one that grows with each new version of software and each new advance in hardware. GIS is fully interactive. Adding new fields of data, taking them off, changing the color scheme or form of the map, adding text, moving symbols, and a host of other capabilities give a user tremendous flexibility and power. GIS displays are zoomable and pannable. Moving around in the display offers a user new perspectives, greater (or less) detail, and new insight. Users can take advantage of computationally intensive functions such as "draping" a perspective view over a surface (like a digital elevation model) or creating the impression of three dimensions on a 2D display (the computer screen) using complex rendering and shading algorithms.
MAP OUTPUT OVERVIEW Design maps for appropriate medium Print vs. electronic Plan a layout Link layouts to map purpose Choose appropriate export options
MAP OUTPUT OVERVIEW Do I know what my map s story is? Am I using the right map projection? Am I using data at the right level of generalization? Is my symbology clear? Do my symbols match my data? Have I used the right text symbols? Do I need to add anything else to my map?
MAP LAYOUT ELEMENTS Main map Map title and subtitle -what, where, and when Legend Data sources Graphic scale North arrow Rectangular boundary (neatline) Inset (overview) maps
FONTS Simple and legible Formal or informal Number of fonts Special characters -degree symbols, degrees minutes seconds, ESRI symbols Placement Halos shadows to contrast background
EXPORTING MAPS Raster BMP, .TIF, .JPG Size/Resolution Color options Vector Enhanced Metafile (.emf), Encapsulated PostScript (.eps), Adobe Illustrator (.ai)