Effective Learning Analytics Integration: Key Considerations
Educational data mining and learning analytics play crucial roles in predicting student success in higher education. This presentation delves into the challenges and myths surrounding learning analytics, emphasizing the importance of careful planning and strategic implementation for its successful integration at institutions. Key concepts such as academic analytics and learner-focused data analysis models are explored, shedding light on the broad approaches to analytics utilization in higher education.

Download Presentation

Please find below an Image/Link to download the presentation.
The content on the website is provided AS IS for your information and personal use only. It may not be sold, licensed, or shared on other websites without obtaining consent from the author.If you encounter any issues during the download, it is possible that the publisher has removed the file from their server.
You are allowed to download the files provided on this website for personal or commercial use, subject to the condition that they are used lawfully. All files are the property of their respective owners.
The content on the website is provided AS IS for your information and personal use only. It may not be sold, licensed, or shared on other websites without obtaining consent from the author.
E N D
Presentation Transcript
The Devil in the detail: Making effective use of learning analytics Angelo Fynn Presentation at the SAAIR Institute and Foundations 11 September 2018
Introduction Educational data mining is concerned with developing, researching and applying automated methods to detect patterns in large educational datasets (Romero, et al. 2010). Learning analytics is being lauded as the panacea to the core issues faced by HEIs While LA has shown promise in terms of developing early identification systems to proactively support students; the promise of LA has yet to be realised in full The purpose of this presentation is to outline the considerations to make while planning the integration of Learning Analytics at the institution.
Introduction Education research is pervaded by a number of studies highlighting the contradictory evidence in predicting and explaining student success and/or persistence These findings can be seen as pervasive myths, lore or collective hysteria Previous limitations in LA Mathematical or statistical modelling Computing power Theoretical development Political and social biases
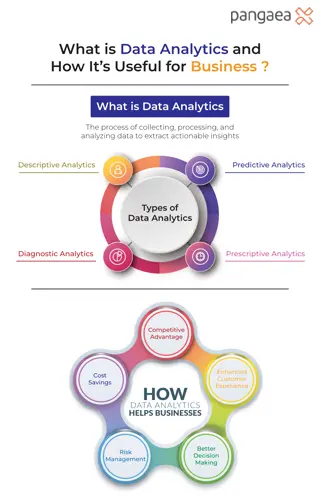
Key concepts Learning analytics: if defined broadly, focuses on learner produced- data and analysis models for predicting individual learning (Siemens, 2010). Academic analytics: focuses on the selection of institutional indicators which are analysed to develop predictive models to generate intelligence that allows learners, academics and administrators to change behaviour (Baepler & Murdoch, 2010). Both approaches derive from behaviourist assumptions of human behaviour, decision making and thinking
Broad approaches to analytics utilisation in HE Theoretically driven approaches Data driven approaches
Lets play a game Success rates among white students is proportionally higher than those among black students The level of melanin equates to level of success at institution The access to quality schooling links to initial success Do we measure this? The level of success equates to access to resources Do we measure this routinely? Success rates are directly linked to matric performance Four year period held as stable The measurement of learning during the process negated Assumes a linear relationship between two time points Assumes that average is indicative of disciplinary performance Explanatory power of matric performance historically low Students are under/unprepared for higher education
Contextual notes for implementing learning analytics Some key considerations to bear in mind What is the key question we want to answer: Who are the students that are failing? Which courses have high completion rates? How many qualifications have attrition rates beyond institutional tolerance levels? Why do students fail/succeed? To answer the above we first need to ask: What are the assumptions made about our student profile? What is the pedagogy that informed T&L at the institution? What outcomes are we measuring against at the module level? Who are the key stakeholders that should receive the information? What is the purpose of the analytics (to intervene/to grant access)?
Key points from Socio-Critical model Academic development first raised the issue of underprepared students in relation to students entering HE contexts from HDI The epistemological, infrastructural and cultural assumptions by institutions Homogenous ideal student body Benchmarks that are not transparent (credit-hour assumptions) Underprepared student myth is pervasive Underprepared institution is less discussed and entrenched
Learning analytics cycle Subotzky & Prinsloo, 2011
Data sphere Data Sphere Student Module Qualification
Analytics views HEMIS reporting Reporting against institutional targets Institutional view Application & Enrolments Qualification attrition Module risk rankings Course success rates Qualification view Course profile Formative assessments Module attrition LMS activity Exam sitting Module view Academic performance profile History at institution Psycho-social profile Study progression Student view
JISC Learning analytics architecture
Case studies of analytics use to support T&L Three instances of analytics use Module level interventions Draft analytics intervention framework Developing customized learning for repeating and supplementary students Student level interventions Progression risk as an alert
Draft analytics framework (Module/Student view) Overall process flow of identification and intervention Assessment 1 Assessment 2 Re- Registration Examination Application registration Consolidated risk assessment Sem1 Risk Risk Risk Risk assessment assessment assessment assessment Risk assessment decision matrix Cat 2 Cat 4 Cat 3 Cat 1 No Monitor Intervene Intervene intervention
Draft analytics framework (Module/Student view) Category 1: AT RISK: Student is said to be at risk if performance on assessment < 50% (is less than 50%) Category 2: MODERATELY AT RISK: A student is said to be at the Border line if 50% X 59% (performance on assessment is greater or equal to 50% but less or equal 59%) Category 3: LOW RISK: A student is said to be low-risk if performance is 60% X 74% (performance on assessment is greater or equal to 60 but less or equal to 74) Category 4: LITTLE TO NO RISK: A student is considered little or no risk if performance on assessment is 75% (assessment mark is equal to or greater than 75%)
Draft analytics framework (Module/Student view) Data Flow matrix Information type Consolidated individual student profile Summary of student risk profile per module Summary of Student risk profile per qualification Intervention uptake per module Student support staff X X X X Stakeholder College management X X X School Director X X X Chair of Department X X Module team Tutors Student X X X X
Customising support for repeating students Drawing profile of repeats off the MIS Drawing exam performance profile off assessment system Requires clearly articulated assessment framework per course May point out flaws in assessment practises Tying profile signals into the assessment domains associated with failure
Progression risks as an alert Prescribed minimum periods provide fixed time periods as anchor measurements Prediction calculated against students own history in the institution Event history models of dropout or stopout See Desjardins Akin to survival analysis, identifies specific events that precede dropout
Where to from here? Identifying stakeholder dataflow Improving data literacy to improve analytics use Driving improved data quality at the institution This would entail evaluating the full data value-chain Centralised reporting platform - PowerHEDA Harmonising policies to create a measureable framework Developing clear guidelines on the ethical use of data Siyaphumalela project, JISC & LACE initiatives.
If you forget everything, remember this: Ensure clear separation on prediction vs causality Dealing with the elephant in the room Analytics based interventions Closing the loop in communication on the analytics Guard against algorithmic regulation


")
")
")