Effective Outcomes-Based Curriculum Improvement Workshop Overview
Explore what to look for in a sustainable outcomes-based curriculum improvement process through a workshop led by educational experts. Gain insights on identifying high-quality processes, common flaws, and how to provide informed critiques. Delve into data-informed curriculum improvement, stakeholder input, program evaluation, data analysis, and more.

Download Presentation

Please find below an Image/Link to download the presentation.
The content on the website is provided AS IS for your information and personal use only. It may not be sold, licensed, or shared on other websites without obtaining consent from the author. If you encounter any issues during the download, it is possible that the publisher has removed the file from their server.
You are allowed to download the files provided on this website for personal or commercial use, subject to the condition that they are used lawfully. All files are the property of their respective owners.
The content on the website is provided AS IS for your information and personal use only. It may not be sold, licensed, or shared on other websites without obtaining consent from the author.
E N D
Presentation Transcript
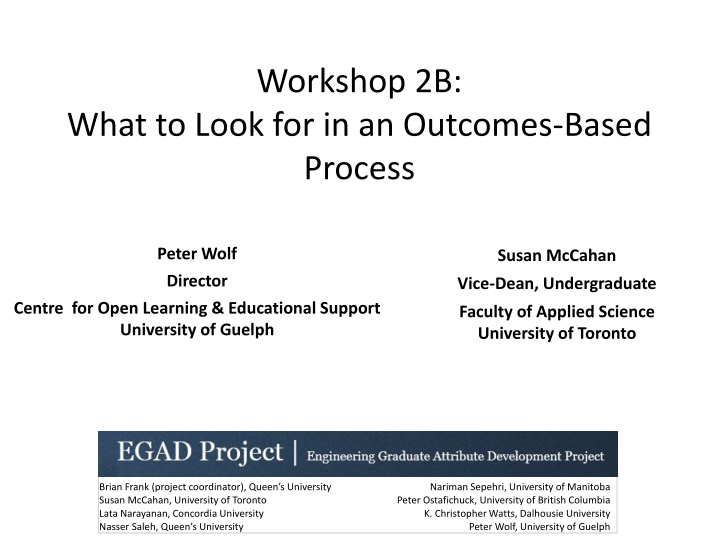
Workshop 2B: What to Look for in an Outcomes-Based Process Peter Wolf Director Susan McCahan Vice-Dean, Undergraduate Centre for Open Learning & Educational Support University of Guelph Faculty of Applied Science University of Toronto Brian Frank (project coordinator), Queen s University Susan McCahan, University of Toronto Lata Narayanan, Concordia University Nasser Saleh, Queen s University Nariman Sepehri, University of Manitoba Peter Ostafichuck, University of British Columbia K. Christopher Watts, Dalhousie University Peter Wolf, University of Guelph
Workshop Outcomes: What makes for a sustainable, effective outcomes-based curriculum improvement process? In this workshop we will examine the parts of an outcome-based curriculum improvement process and identify the characteristics of a high quality process. We will also discuss common flaws that can undermine an outcome-based process; learn how to identify such flaws, and how to correct them. Short case studies will be used to give participants an opportunity to apply what they are learning in the workshop. You should be able to Identify the characteristics of a high quality outcomes-based curriculum improvement process Begin to provide an informed critique of a continuous curriculum improvement process 2
Agenda: What to look for - overall - at each step 5. Data-informed curriculum improvement: Setting priorities and planning for change 1. Program Evaluation: Defining purpose and indicators 4. Analyzing and Interpreting the data Stakeholder input 2. Mapping the Curriculum 3. Identifying and Collecting Data 3
Perspective: Sec 3.1 of CEAB Procedures The institution must demonstrate that the graduates of a program possess the attributes under the following headings... There must be processes in place that demonstrate that program outcomes are being assessed in the context of these attributes, and that the results are applied to the further development of the program. 4
Activity: How do we ideally critique a research report, journal article, or grant proposal? 5
Frame this as a research study on your curriculum From perspective of learners, and outcomes NOT inputs, teaching 6
Overall process What to look for: Research questions and methodology are well defined and align with outcomes Process is includes all key elements Process is well defined and sustainable Process is continuous: cycle of data collection and analysis is explained 7
Research Questions: case study 1. What are students strengths and weaknesses in communication ability after completing our program? 2. There are several courses we think teach and utilize investigation skills; where are students really learning to investigate a problem? 3. Where does the program cover project management? 4. How many times do students participate in team based projects? 5. Does our students problem solving ability meet our expectations? 8
Sample Process Framework (contd) Example 1: data collection by attribute Task 2011/ 12 2012/ 13 2013/ 14 2014/ 15 Group 1 Attributes X Group 2 Attributes X Group 3 Attribute X Integration of all Attributes X Example 2: classic longitudinal study in 12 dimensions (i.e. cohort follow ) Task 2011/ 12 2012/ 13 2013/ 14 2014/ 15 2015/16 Year 1 - X X Year 2 - X Year 3 - X Year 4 - X X
Sample Process Framework (contd) Example 3: data collection by snapshot Task 2011/ 12 2012/ 13 2013/ 14 2014/ 15 2015/16 All attribute areas X X Report data for visit X Example 4: Data collection on all attributes at graduation Task 2011/ 12 2012/ 13 2013/ 14 2014/ 15 2015/16 Year 4 X X X X X Example 5 Collect data on every attribute every year across the whole curriculum
Sample Process Framework (contd) Example 1 Task 2012-13 2013-14 2013/ 14 2014/ 15 X Graduate Survey X X X Student Portfolios Review Student/Faculty Feedback X Alumni Survey X Employer Focus Group X Faculty& Student Workshops/Retreat X X X Review assessment process & adapt X
1 Program Evaluation: Getting Started 2 Mapping the Curriculum 3 Identifying and collecting data on student learning 4 Analyzing and Interpreting the Data 5 Data-Informed Curriculum Improvement: Setting Priorities and Planning for Change 12
1. Program Evaluation: Defining purpose and indicators Graduate Attributes: 12 defined by CEAB Characteristics of a graduating engineer A broad ability or knowledge base to be held by graduates of a given undergraduate engineering program Indicators: Descriptors of what students must do to be considered competent in an attribute; the measurable and pre-determined standards used to evaluate learning. 13
Indicators Investigation: An ability to conduct investigations of complex problems by methods that include appropriate experiments, analysis and interpretation of data, and synthesis of information in order to reach valid conclusions 1) For Attribute #3 (Investigation), which of the following potential indicators are appropriate? a) Complete a minimum of three physical experiments in each year of study. Be able to develop an experiment to classify material behaviour as brittle, plastic, or elastic. Be able to design investigations involving information and data gathering, analysis, and/or experimentation Learn the safe use of laboratory equipment Understand how to investigate a complex problem b) c) d) e) 2) What are other potential indicators for this attribute? 3) How many indicators are appropriate for this attribute? Why?
1. Program Evaluation: Defining purpose and indicators What to look for: Indicators align with attributes and research questions Indicators are leading indicators : central to attribute; indicate competency Enough indicators defined to identify strength areas; and weak areas (but not too many) Indicators are clearly articulated and measurable 15
Example: Adapted from Queens, 2010 # Attribute Primary Year Shortname Description Identifies known and unknown information, uncertainties, and biases when presented a complex ill-structured problem First Identify problem Identifies problem, known and unknown information, uncertainties, and biases Graduating First Graduating Creates process for solving problem including justified approximations and assumptions Create process Problem analysis 2 Selects and applies appropriate quantitative model and analysis to solve problems First Select model Selects and applies appropriate model and analysis to solve problems Graduating First Graduating Evaluates validity of results and model for error, uncertainty Evalute solution First Generates ideas Generates ideas and working hypothesis Designs investigation Designs investigations involving information and data gathering, analysis, and/or experimentation First 3 Investigation First Synthesizes data Synthesizes data and information to reach conclusion Appraise conclusions Appraises the validity of conclusion relative to the degrees of error and limitations of theory and measurement Adapts general design process to design system, component, or process to solve open-ended complex problem. First First Uses process Identify design problem Identify design problem Accurately identifies significance and nature of a complex, open-ended problem First 4 Design Identifies problem and constraints including health and safety risks, applicable standards, economic, environmental, cultural and societal considerations Graduating 16
2. Mapping the Curriculum Goal: Where are the students learning? Where are we already assessing learning? Start to identify assessment checkpoints 17
2. Mapping the Curriculum What to look for: Information in the map is Accurate, with some depth, identifies outcomes Not simply a list of topics covered Map provides information for each attribute Can include curricular and other experiences Map indicates where the attribute is: Taught: possibly with some information Assessed Points of planned data collection 18
Curriculum Assessment Case Study Curriculum Context: Small applied sciences undergraduate with approximately 200 students 20 faculty (40% of whom are non-native English speakers) with no sessional/contract instructors Question: There is a suspicion and concern amongst faculty that the writing skills of students is lower than desired. Is this the case? If so, how to adapt curriculum & related practices to further enhance student writing
Data Collection: Map writing to courses Survey of student work Student survey on writing development Department meeting discussion (including TAs, contract instructors, academic counselors, etc.)
Relevant qualitative data: Students wish they had more opportunities to develop writing skills Samples show consistently lower-than-desired level of sophistication The department meeting included discussion about: The large international proportion of faculty The appropriateness of scientists teaching writing A reluctance to teach and assess writing in general from faculty A lack of resources and tools for those faculty interested but unsure how to go about it
Courses available to Majors 25 20 15 Major courses Pre-Requisites Free electives 10 5 0 1st year 2nd year 3rd year 4th year
Mapping Writing 18 16 14 12 Not Taught / Not Assessed 10 Not Taught / Assessed 8 Taught / Not Assessed Taught / Assessed 6 4 2 0 3rd year 4th year
Continuous improvement of the curriculum can lead to: Superior graduating students Evidence of graduating student quality Opportunity for individual student & programme autonomy Enhanced time & resource usage Note: in the Graduate Attributes process curriculum mapping is a step toward outcomes assessment, not the end goal can yield important insights into curriculum and improvement opportunities 24
3. Collecting Data on Student Learning Data collection can include: Qualitative data Quantitative data Ultimately is translated into information that addresses the research questions On the indicator being assessed At a particular, identified point in the program 25
3. Collecting Data on Student Learning What to look for: Assessment aligns with indicator; i.e. valid data Triangulation is used: i.e. reliable data collection within reason Assessment scoring is well designed levels are well described, and appropriate Assessment avoids double barreled (or more) scoring Sampling is used appropriately Data collected for assessing the program/cohort quality, not an assessment of student 26
Case Studies 1. Communication: Ability to develop a credible argument is assessed using a multiple choice test. 2. Communication: Ability to develop a credible argument is assessed using a lab report discussion section. Grading is done based on word count. 3. Investigation: Ability to develop an investigation plan is assessed using a lab report that requires experiment design. 4. Ethics: Ethics is assessed only using the grade in an ethics course. 5. Design: Ability to generate creative design ideas is assessed using a student survey. 6. Knowledge base: A course grade in physics is used to assess physics knowledge base. 27
1 2 3 4 Mark (not demonstrated) No significant information used, not cited; blatant plagiarism. (marginal) (meets expectations) Gathers and uses information from appropriate sources, including applicable standards, patents, regulations as appropriate, with proper citations Plans and efficiently manages time and money; team effectively used meetings; safety considerations are clear (outstanding) Insufficient usage; improper citations. Uses information from multiple authoritative, objective, reliable sources; cited and formatted properly Gathers information from appropriate sources 3.04-FY4: Gathers info /4 No useful timeline or budget described; poorly managed project; safety issues No discussion of design process. Poor timeline or budget; infrequent meetings; minor safety problems Efficient, excellent project plan presented; detailed budget; potential risks foreseen and mitigated Plans and manages time and money 3.11-FY1: Manage time and money /4 Describes design process 3.04-FY1: Uses process /4 Generic design process described. Describes design process used to design system, component, or process to solve open-ended complex problem. Incorporated appropriate social, environmental, and financial factors in decision making Comprehensive design process described, with appropriate iterations and revisions based on project progress Well-reasoned analysis of these factors, with risks mitigated where possible /4 No consideration of these factors. Factors mentioned but no clear evidence of impact on decision making. Incorporates social, environmental, and financial factors 3.09-FY4: Sustainability in decisions Demonstrates appropriate effort in implementation Insufficient output Outstanding implementation /4 Sufficient implementation but some opportunities not taken, or feedback at proposal not incorporated in implementation Some factors missed in evaluating design solution Appropriate effort, analysis, and/or construction demonstrated to implement product, process, or system /4 No evaluation of design solution Compares the design solution against the project objectives and functional specifications, providing qualitative evaluation where appropriate Report achieves goal using formal tone, properly formatted, concisely written, appropriate use of figures, few spelling/grammar errors Comprehensive evaluation of design solution, with well- defended recommendations for future work or implementation Professional tone, convincing argument, authoritative, skillful transitions Compares design solution against objectives 3.04-FY7: Compares solution /4 Poorly constructed report Some organization problems, minor formatting problems, redundancy, spelling grammar/errors Creates report following requirements /28 Overall Grade: 29 Sample Rubric (Queens) threshold target
Mapping Indicators to Existing Evaluation (UofT) 1. Ability to define the problem State the problem, its scope and importance Describe the previous work State the objective of the work 1. Ability to identify and credibly communicate engineering knowledge Situate, in document or presentation, the solution or design in the world of existing engineering, taking into account social, environmental, economic and ethical consequences Recognize a credible argument (reading) Construct a credible argument in written or spoken form to persuasively present evidence in support of a claim Organize written or spoken material to structure overall elements so that their relationship to a main point and to one another is clear Create flow in document or presentation flow is a logical progression of ideas, sentence to sentence and paragraph to paragraph 30
Old Evaluation Form (UBC) Is the parameter/factor being studied important to the overall project success? The team should be able to describe why they are conducting the prototype test and what they hope to find with it. They should be able to explain why this particular prototype test is preferred over a calculation or simulation. Has an appropriate prototyping method been selected? Given what the teams want to find, have they selected a good approach? (Does it have sufficient accuracy? Is it reasonably insensitive to other parameters? Is there an obvious better/simpler/more accurate way to run the test?) What is the quality of the prototype, the test execution, and the results? Did the team do a good job in building their prototype, running their tests, and analyzing/interpreting the data? Are the findings being used appropriately? How does the team plan to incorporate the results of the prototype test to their design? Do they understand the limitations of the data they have collected? Totals 0 1 2 3 4 5 31
Evaluation Reformatted as Rubric (UBC) Level of Mastery Criterion Unacceptable Below Expectations Meets Expectations Exceeds Expectations 0 1 2 3 Parameter studied is appropriate for project, AND the team is able to provide some justification why. Parameter studied is appropriate for project, AND the team is able to provide strong justification why. Team is NOT able to identify the parameter they are using the prototype to study. Parameter studied is NOT directly relevant to project success. 2.1 Problem Identification Prototyping method is appropriate for the parameter being studied, AND the team is able to clearly justify why the physical prototype used is superior to other physical or virtual prototypes. Prototyping method is NOT appropriate for the parameter being studied (i.e. will not yield desired data). Prototyping method is at least somewhat appropriate for the parameter being studied; a simpler approach MAY exist 3.2 Investigation Design Team has NOT built a prototype. The prototype works BUT data collection / analysis techniques are inappropriate. Data collection and analysis are done appropriately AND data quality is fair. Data collection and analysis are done appropriately AND data is of high quality. 3.3 Data Collection No data collected; prototype does NOT work Appropriate conclusions are drawn from the data, AND the team is able to provide some explanation of how the data affects the project. Some implications are overlooked. Appropriate conclusions are drawn from the data, AND the team is able to provide strong and complete explanation of how the data affects the project. Appropriate conclusions are drawn from the data, BUT the team is NOT able to explain the how the data affects the project. No conclusions are drawn, OR inappropriate conclusions are drawn. 3.4 Data Synthesis The team considers errors, limitations, and validity in the tests, BUT does NOT quantify errors or take appropriate action. The team quantifies errors, and considers limitations and validity, AND takes action, BUT action is limited or somewhat inappropriate. The team quantifies errors, and considers limitations and validity, AND is able to justify and take appropriate action. The team does NOT consider limitations or errors in the tests, or validity of the conclusions. 3.5 Analysis of Results 32
4. Analyzing and interpreting the data Timing of data collection and analysis Analysis of the data Data used to inform the improvement plan. 33
4. Analyzing and Interpreting the data What to look for: Timing of data collection and analysis is clear, and continuous (cyclic). Analysis is high quality and addresses the data Improvement plan aligns with the analysis and data Improvement plan is implemented 34
5. Data-informed Curriculum Improvement The process of closing the loop Information collected, analyzed and used for curriculum improvement 35
5. Data-informed Curriculum Improvement What to look for: Integrity of the overall research method: Quality of the research questions Quality of the methodology Indicators Curriculum mapping Data collection process Valid, reliable data collected Analysis of the data is clear and well grounded Results used to inform curriculum change 36
Disaggregating the data to get more information Performance histogram - Fails - Below Expectation - Meets Expectation - Exceeds Expectation Indicator #2 Indicator #1 Indicator #3 Investigation 37
Disaggregating the data to get more information Performance histogram - First year - Middle year - Final year Indicator #2 Indicator #1 Indicator #3 Investigation 38
Why not use grades to assess outcomes? How well does the program prepare students to solve open-ended problems? Student transcript Electric Circuits I Electromagnetics I Signals and Systems I Electronics I Electrical Engineering Laboratory Engineering Communications Engineering Economics ... Electrical Design Capstone 78 56 82 71 86 76 88 Are students prepared to continue learning independently after graduation? Do students consider the social and environmental implications of their work? 86 What can students do with knowledge (plug-and-chug vs. evaluate)? Course grades usually aggregate assessment of multiple objectives, and are indirect evidence for some expectations 39
Rubrics Scale (Level of Mastery) Dimensions (Indicator) Not Meets expectations Exceeds expectations Marginal demonstrated Indicator 1 Descriptor 1a Descriptor 1b Descriptor 1c Descriptor 1d Indicator 2 Descriptor 2a Descriptor 2b Descriptor 2c Descriptor 2d Indicator 3 Descriptor 3a Descriptor 3b Descriptor 3c Descriptor 3d Reduces variations between grades (increase reliability) Describes clear expectations for both instructor and students (increase validity) 40
Histograms for Lifelong learning (Queens) 60 50 Percentage (%) 40 30 20 10 0 FEAS - 3.12-FY1 FEAS - 3.12-FY2 FEAS - 3.12-FY5 FEAS - 3.12-FY6 Attributes 1 - Not Demonstrated 2 - Marginal 3 - Meets Expectations 4 - Outstanding 3.12-FY1 Uses information effectively, ethically, and legally to accomplish a specific purpose, including clear attribution of Information sources. 3.12-FY2 Identifies a specific learning need or knowledge gap. 3.12-FY5 Identifies appropriate technical literature and other information sources to meet a need 3.12-FY6 Critically evaluates the procured information for authority, currency, and objectivity. 41
Histogram for Communication (UofT) several assessment points in ECE496 Percentage of students who meet or exceed performance expectations in indicators 100% 80% 60% 40% 20% 0% Define the Problem Devise and execute a plan to solve the problem Use critical analysis to reach valid conclusions 42
Histogram for Communication (UofT) Percentage of students who meet or exceed performance expectations in indicators 100% 80% 60% 40% 20% 0% Define the Problem Devise and execute a plan to solve the problem Use critical analysis to reach valid conclusions 43
Histograms / Summary for Design (UBC) Attribute 4: Design Overall 1st Year 2nd Year An ability to design solutions for complex, open-ended engineering problems and to design systems, components or processes that meet specified needs with appropriate attention to health and safety risks, applicable standards, and economic, environmental, cultural and societal considerations. 100% 100% 100% 50% 50% 75% 75% 0% 0% BE ME EE BE ME EE 50% 3rd Year 4th Year 100% 100% 19% 25% Below Expectations: 6% Meets Expectations: 75% Exceeds Expectations: 19% 50% 50% 6% 0% 0% 0% BE ME EE BE ME EE BE ME EE Indicator Summary Courses and elements assessed MECH 223 MECH 223 MECH 45X Concept selection report 4.4 Solution Generation Produce a variety of potential design solutions suited to meet functional specifications Formal report 1 & 2 Oral presentation 1 & 2 100% 50% 0% BE ME EE 4.5 Solution Evaluation Perform systematic evaluations of the degree to which several design concept options meet project criteria MECH 223 MECH 223 MECH 45X Formal report 1 & 2 Oral presentation 1 & 2 Concept selection report 100% 50% 0% BE ME EE 4.6 Detailed Design Apply appropriate engineering knowledge, judgement, and tools, in creating and analyzing design solutions criteria MECH 223 MECH 325 MECH 45X Formal report 1 & 2 Assignments 1-5 Preliminary design report 100% 50% 0% BE ME EE 44


")
")
")


")
")
")


")
")
")
")