Explore the concept of portfolio management, which involves security analysis and portfolio maintenance to achieve optimal returns while minimizing risk. Learn about the portfolio management process, investment objectives, asset allocation, and the key steps to successful portfolio management.
Please find below an Image/Link to download the presentation.
The content on the website is provided AS IS for your information and personal use only. It may not be sold, licensed, or shared on other websites without obtaining consent from the author. If you encounter any issues during the download, it is possible that the publisher has removed the file from their server.
You are allowed to download the files provided on this website for personal or commercial use, subject to the condition that they are used lawfully. All files are the property of their respective owners.
The content on the website is provided AS IS for your information and personal use only. It may not be sold, licensed, or shared on other websites without obtaining consent from the author.
Introduction The traditional investments course covers two principal topics: 1. SecurityAnalysis 2. Portfolio Management Security Analysis involves estimating the merits and demerits of individual investments. Portfolio maintenance of a collection of investments. The aim of portfolio management is to achieve the maximum return from a portfolio. Management concerns the construction and
What is Portfolio? Portfolio refers to invest in a group of securities rather to invest in a single security. Don t Put all your eggs in one basket Portfolio help in reducing risk without sacrificing return.
Portfolio management Portfolio Management is the process of creation and maintenance of investment portfolio. Portfolio management is a complex process which tries to make investment activity more rewarding and less risky. Portfolio management is a process of many activities that aimed investment. which may following steps. to optimizing comprises the the of
Contd Investopedia Management as The art and science of making decisions about investment mix and policy, matching investments to objectives, individuals and institutions, and balancing risk against performance. It further explains that portfolio management is all about strengths, weaknesses, threats in the choice of debt vs. equity, domestic vs. international, growth vs. safety, and many other tradeoffs encountered in the attempt to maximize return at a given appetite for risk. Dictionary defines Portfolio asset allocation for opportunities and
4. Portfolio Management Process A. Specification of investment objectives and constraints B. Choice of asset mix/ asset allocation C. Formulation of portfolio strategy D. Securities analysis E. Portfolio selection F. Portfolio revision G. Portfolio performance evaluation H. Portfolio Evaluation Each phase is essential and the success of each phase is depend on the efficiency in carrying out each phase.
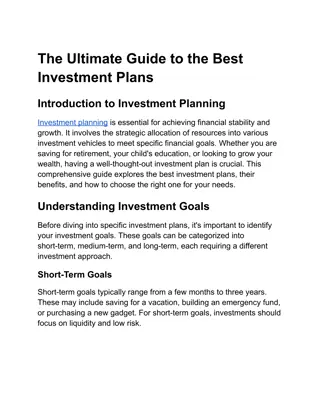
A). Specification of investment objectives and constraints Objectives: investment are: Income: to provide a steady stream of income through regular interest/dividend payment Growth: to increase the value of the principal amount through capital appreciation Stability: to protect the principal amount invested from the risk of loss the commonly stated objectives of
Contd Constraints: constraints arising out of or relating to the following factors; Liquidity: refers to the speed and ease with which an asset can be sold, without suffering a significant cost or discount to its fair market value. Investment horizon: the investment horizon is the time till the investment or part of the planned to be liquidated to meet a specific need. Longer investment horizons generally requires less liquidity and more risk tolerance Taxes: Tax considerations therefore have an important bearing on investment decisions
Contd Regulations: generally not constrained much by law, institutional investors have to conform to various regulations. Unique Circumstances: Any special needs or constraints not recognized in any of the constraints listed above would fall in this category. An example of a unique circumstance would be the constraint an investor might place on investing in any company that is not socially responsible, such as a tobacco company. while individual investors are
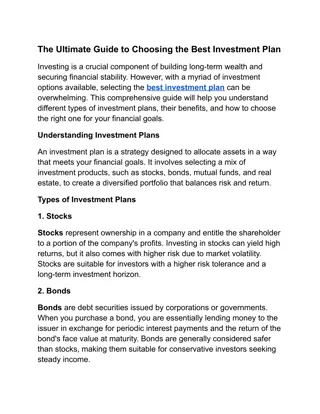
B). Choice of asset mix/ asset allocation B). Choice of asset mix/ asset allocation Based on the objectives and constraints of investment, investors have to specify their asset allocation that is they have to decide how much of their portfolio has to be invested in different asset classes. Asset mix means a proportions of stocks (Ex: Equity shares and preference shares) and bonds (fixed income securities) in the portfolio.
Contd An asset allocation focuses on determining the mixture of asset classes that is most likely to provide a combination of risk and expected return that is optimal for the investor. process of deciding how to distribute an investor s wealth among different countries and asset classes for investment purposes. The two categories in asset allocation include: Strategic asset allocation; Tactical asset allocation.
Contd Strategic classes and the proportions for those asset classes that would comprise the normal asset allocation. Strategic asset allocation is used to derive long-term asset allocation weights. Generally, these weights are not changed over time. When market values change, the investor may have to adjust the portfolio annually or after major market moves to maintain the desired fixed-percentage allocation. asset allocation: asset identifies
Contd Tactical asset allocation: produces temporary asset allocation weights that occur in response to temporary changes in capital market conditions. The investor s goals and risk- return preferences are assumed to remain unchanged as the asset weights are occasionally revised to help attain the investor s constant goals.
Contd Alternative asset allocations are often related with the different approaches to risk and return, identifying conservative, moderate allocation. The conservative allocation is focused on providing low return with low risk; The moderate average return with average risk and The aggressive high return and high risk. and aggressive asset
C). Formulation of portfolio strategy After an investor has chosen a certain asset mix, she/he has to formulate an appropriate portfolio strategy. The two broad choices of portfolio strategy include; active portfolio strategy and passive portfolio strategy Active Portfolio Management The portfolio manager invests in securities of their choosing
Contd Active Portfolio Strategy An active portfolio strategy is followed by most investment professionals and aggressive investors who strive to earn superiorreturns, after adjustment for risk. Passive portfolio Strategy The main points for the passive portfolio management: holding securities in the portfolio for the relatively long periods with small and infrequent changes; Investors act as if the security markets are relatively efficient. The portfolios they hold (replacements) for the market portfolio (index funds). may be surrogates
D ). Securities analysis There are many types of securities available in the market including equity shares, preference shares, debentures and bonds. This step consists of examining the risk-return characteristics' of individual securities. It depends on the sources of information. Securities are analyzed from the point of their prices, returns, and risks. During the security analysis fundamental and technical analysis help in the selection of securities
E).Portfolio Analysis A portfolio refers to a group of securities that are kept together as an investment. Investors make investment in various securities to diversify the investment to make it risk averse. A large number of portfolios can be created by using the securities from desired set of securities obtained from initial phase of security analysis.
Contd By selecting the different sets of securities and varying the amount of investments in each security, various portfolios are designed. After identifying the range of possible portfolios, the risk-return characteristics are measured and expressed quantitatively. It involves the mathematically calculation of return and risk of each portfolio.
F). Portfolio Selection F). Portfolio Selection During this phase, portfolio is selected on the basis of input from previous phase Portfolio Analysis. The main target of the portfolio selection is to build a portfolio that offer highest returns at a given risk. The portfolios that yield good returns at a level of risk are called as efficient portfolios. The set of efficient portfolios is formed and from this set of efficient portfolios, the optimal portfolio is chosen for investment. The optimal portfolio is determined in an objective and disciplined way by using the analytical tools and conceptual framework provided by Markowitz s portfolio theory
G). Monitoring and Portfolio Revision After selecting the optimal portfolio, investor is required to monitor it constantly to ensure that the portfolio remains optimal with passage of time. Due to dynamic changes in the economy and financial markets, the attractive securities may cease to provide profitable returns. These market changes result in new securities that promises high returns at low risks. In such conditions, investor needs to do portfolio revision by buying new securities and selling the existing securities. As a result of portfolio revision, the mix and proportion of securities in the portfolio changes.
H). Portfolio Evaluation This phase involves the regular analysis and assessment of portfolio performances in terms of risk and returns over a period of time. During this phase, the returns are measured quantitatively along with risk born over a period of time by a portfolio. The performance of the portfolio is compared with the objective norms. Moreover, this procedure assists in identifying the weaknesses in the investment processes.
Risk-Adjusted Portfolio Performance Evaluation Methods The risk-adjusted methods make adjustments to returns in order to take account of the differences in risk levels between the managed portfolio and the benchmark portfolio. While there are many such methods, the most notables are the Sharpe ratio (S), Treynor ratio (T), Jensen s alpha (a) and Modigliani and Modigliani (M2). These measures, along with their applications, are discussed below.
1. Sharpe Ratio The Sharpe ratio (Sharpe, 1966) computes the risk premium of the investment portfolio per unit of total risk of the portfolio. The risk premium, also known as excess return, is the return of the portfolio less the risk-free rate of interest as measured by the yield of a Treasury security. The total risk is the standard deviation of returns of the portfolio. The numerator captures the reward for investing in a risky portfolio of assets in excess of the risk-free rate of interest while the denominator is the variability of returns of the portfolio. In this sense, the Sharpe measure is also called the reward-to- variability ratio.
Contd / ) Sharpe s ratio = ( R R P rf P P R : The average return for portfolio p during some period of time; Where R : The average risk-free rate of return during the period; : Standard deviation of returns for portfolio p during the period. rf P
Contd The Sharpe ratio for an investment portfolio can be compared with the same for a benchmark portfolio such as the overall market portfolio.
Example Suppose that a managed portfolio earned a return of 20 percent over a certain time period with a standard deviation of 32 percent. Also assume that during the same period the Treasury bill rate was 4 percent, and the overall stock market earned a return of 13 percent with a standard deviation of 20 percent. The managed portfolio s risk premium is (20 percent 4 percent) = 16 percent, while its Sharpe ratio, S, is equal to 16 percent/32 percent = 0.50. The market portfolio s excess return is (13 percent 4 percent) = 9 percent, while its S equals 9 percent/20 percent = 0.45.
Contd Accordingly, for each unit of standard deviation, the managed portfolio earned a risk premium of 0.50 percent, which is greater than that of the market portfolio of 0.45 percent, suggesting that the managed portfolio outperformed the market after adjusting for total risk.
2. Treynor Ratio The Treynor ratio (Treynor, 1965) computes the risk premium per unit of systematic risk. The risk premium is defined as in the Sharpe measure. The difference in this method is in that it uses the systematic risk of the portfolio as the risk parameter. The systematic risk is that part of the total risk of an asset which cannot be eliminated through diversification. It is measured by the parameter known as beta that represents the slope of the regression of the returns of the managed portfolio on the returns to the market portfolio. The Treynor ratio is given by the following equation:
Contd / ) Treynor s ratio = ( R R P rf P P Beta, measure of systematic risk for the portfolio p. Where:
Example Suppose that the beta of the managed portfolio in the previous example is 1.5. By definition, the beta of the market portfolio is equal to 1.0. This means the managed portfolio has one-and-half times more systematic risk than the market portfolio. We would expect the managed portfolio to earn more than the market because of its higher risk. In fact, in the above example, the portfolio earned an excess return of 16 percent whereas the market earned only 9 percent. These two numbers alone do not tell anything about the relative performance of the portfolio since the portfolio and the market have different levels of market risk.
Contd In this instance, the Treynor ratio for the managed portfolio equals (20 percent 4 percent)/1.5 = 10.67, while that for the market equals (13 percent 4 percent)/1.00 = 9.00. Thus, after adjusting for systematic risk, the managed portfolio earned an excess return of 10.67 percent for each unit of beta while the market portfolio earned an excess return of 9.00 percent for each unit of beta. Thus, the managed portfolio outperformed the market portfolio after adjusting for systematic risk.
3. Jensens Alpha Jensen s alpha (Jensen, 1968) is based on the Capital Asset Pricing Model (CAPM) of Sharpe (1964), Lintner (1965), and Mossin (1966). The alpha represents the amount by which the average return of the portfolio deviates from the expected return given by the CAPM. The CAPM specifies the expected return in terms of the risk-free rate, systematic risk, and the market risk premium. The alpha can be greater than, less than, or equal to zero. An alpha greater than zero suggests that the portfolio earned a rate of return in excess of the expected return of the portfolio. Jensen s alpha is given by.
Contd + Jensen s Alpha = ( [ ( )] R R R R P rf m rf P R - The average return on the market in period t; Where: m R - The market risk premium during period t. ( ) R m rf
Example Using the same set of numbers from the previous example, the alpha of the managed portfolio and the market portfolio can be computed as follows. The expected return of the managed portfolio is 4 percent + 1.5 (13 percent 4 percent) = 17.5 percent. Therefore, the alpha of the managed portfolio is equal to the actual return less the expected return, which is 20 percent 17.5 percent = 2.5 percent. Since we are measuring the expected return as a function of the beta and the market risk premium, the alpha for the market is always zero. Thus, the managed portfolio has earned a 2.5 percent return above that must be earned given its market risk. In short, the portfolio has a positive alpha, suggesting superior performance.
4. Modigliani and Modigliani Measure (M2) The Sharpe ratio is not easy to interpret. In the example, the Sharpe ratio for the managed portfolio is 0.50, while that for the market is 0.45. We concluded that the managed portfolio outperformed the market. The difficulty, however, is that the differential performance of 0.05 is not an excess return. Modigliani and Modigliani (1997) measure, which is referred to as M2, provides a risk-adjusted measure of performance that has an economically meaningful interpretation. The M2 is given by equation 1 below:
Contd where M2 is the Modigliani-Modigliani measure, rp* the return on the adjusted portfolio, rm the return on the market portfolio. The adjusted portfolio is the managed portfolio adjusted in such a way that it has the same total risk as the market portfolio. The adjusted portfolio is constructed as a combination of the managed portfolio and risk-free asset, where weights are specified as in Equations (2) and (3) below respectively.
Contd where wrp represents the weight given to the managed portfolio, which is equal to the standard deviation of the market portfolio (sm) divided by the standard deviation of the managed portfolio (sp). wrf is the weight on the risk-free asset and is equal to one minus the weight on the managed portfolio. The risk of the adjusted portfolio (sp*) is the weight on the managed portfolio times the standard deviation of the managed portfolio as given in Equation (4) below. By construction, this will be equal to the risk of the market portfolio.
Contd The return of the adjusted portfolio (rp*) is computed as the weighted average of the returns of the managed portfolio and the risk-free rate, where the weights are as in Equations (2) and (3) above:
Contd The return on the adjusted portfolio can be readily compared with the return on the market portfolio since both have the same degree of risk. The differential return, M2, indicates the excess return of the managed portfolio in comparison to the benchmark portfolio after adjusting for differences in the total risk. Thus, M2 is more meaningful than the Sharpe ratio.
Example In the previous example above, the standard deviation of the managed portfolio is 32 percent and the standard deviation of the market portfolio is 20 percent. Hence, the wrp = 20/32 = 0.625, and wrf = 1 0.625 = 0.375. The adjusted portfolio would be 62.5 percent invested in the managed portfolio and 37.5 percent invested in Treasury bills. Now the risk of the adjusted portfolio, sp* = 0.625 x 32 percent = 20 percent, is the same as the risk of the market portfolio. The return on the adjusted portfolio would be rp* = 0.375 x 4 percent + 0.625 x 20 percent = 14 percent. The M2 = 14 percent 13 percent = 1 percent. Thus, on a risk-adjusted basis, the managed portfolio has performed better than the benchmark by 1 percent.
Exercise Consider the following information for three mutual funds P, Q, and R, and the market Mean return (%) Standard deviation (%) P 15% 20% Q 17 24 R 19 27 Market index 16 20 The mean risk free rate was 10%. Calculate the Treynor measure, Sharpe measure, Jensen measure, and M2 for the three funds. Beta 0.90 1.10 1.20 1.00
Chapter Eight Financial Ethiopia-Group Assignment Markets and Institutions in Prepare your own term paper on the current status of financial sector and financial market in Ethiopia


. Specification of investment objectives")


. Choice of asset mix/ asset allocation")


. Formulation of portfolio strategy")

. Securities analysis")
.Portfolio Analysis")

. Portfolio Selection")
. Monitoring and Portfolio Revision")
. Portfolio Evaluation")


")