Effective Project Management Strategies by Ardavan Asef-Vaziri
Explore project management insights on financial analysis, project selection, and production decisions by Ardavan Asef-Vaziri. Learn about quantitative methods, cost world solutions, and activity-based costing contributing to effective decision-making in projects.

Download Presentation

Please find below an Image/Link to download the presentation.
The content on the website is provided AS IS for your information and personal use only. It may not be sold, licensed, or shared on other websites without obtaining consent from the author. If you encounter any issues during the download, it is possible that the publisher has removed the file from their server.
You are allowed to download the files provided on this website for personal or commercial use, subject to the condition that they are used lawfully. All files are the property of their respective owners.
The content on the website is provided AS IS for your information and personal use only. It may not be sold, licensed, or shared on other websites without obtaining consent from the author.
E N D
Presentation Transcript
Project Management Ardavan Asef-Vaziri
Analysis of Projects Financial & Scoring
Project Selection: Quantitative Methods Financial Assessment Methods Payback period Discounted cash flow NPV IRR B/C Scoring Methods Unweighted 0-1 factor method Weighted factor scoring method Ardavan Asef-Vaziri 3
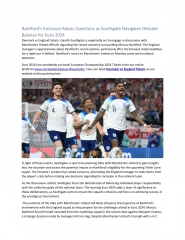
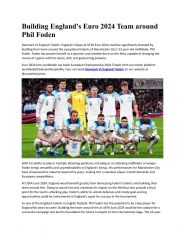
Practice; Follow the 5 Steps Process Two products, P and Q. Weekly demand for P is 100 units & for Q is 50 units. $90 / unit 100 units / week $100 / unit 50 units / week Q: P: D D Purchased Part $5 / unit 15 min. 5 min. C B C 10 min. 5 min. 15 min. Operating expenses per week: $6,000. It includes $2000 administrative costs for the manager who works as operations, finances, and marketing manager, and $4000 non- -administrative costs for the 4 operators working at the work-centers A, B, C, and D. Time available at each work center is 2,400 minutes per week. A A B 15 min. 15 min. 10 min. RM1 $20 per unit RM2 $20 per unit RM3 $20 per unit Ardavan Asef-Vaziri 4
What Product to Produce? Cost World Solution. Sales View: Suppose you are the sales manager and you will be paid a 10% commission on the sales Price. What product do you recommend to produce? P: Sales Price = $90 commission /unit = $9 Q: Sales Price = $100 commission /unit = $10 Q Cost Accounting View- Standard Costing. Overhead operating expense - is $6000 per week. Standard cost accounting is a Generally Accepted Accounting Principle (GAAP). It attempts to absorb all the overhead costs of production into the product cost using a single cost driver. Usually the overheads are directly allocated among the various products in proportion to the cost driver of direct labor cost. The choice of the cost driver depends on the nature of the business. Ardavan Asef-Vaziri 5
What Product to Produce? Cost World Solution. We assume our operating expense is allocated in proportion to the potential market (50+100 =150). If we can satisfy all the demand, then overhead is $6000/150 = $40 per unit of product. If the total demand is not satisfied, overhead per unit of product is > $40. Material Operating Expense Standard Costing Total Cost 85 80 Q Product Cost-Standard Costing P Q 5+20+20 = 45 20+20 = 40 40 40 Activity Based Costing (ABC). ABC is an alternative accounting principle. Instead of direct allocation the overhead costs to the products, overheads are first allocated to activities, and then activity costs are allocated to the products. In the ABC of our example, administrative cost is allocated based on the time spent on each product. Ardavan Asef-Vaziri 6
What Product to Produce? Cost World Solution. Our manager spends 80% of his time on P ($1600) and 20% on Q ($400). Perhaps because product P is a new product and needs more operations/marketing efforts. These costs are then allocated to the units of products based on the potential number of units produced. $1600/100 = $16 (P) and $400/50 = $8 (Q). Non-administrative costs are allocated based on the potential number of units produced. Total Market P (100) and Q(50) $4000 /150 = 26.7 per unit. Material Operating Expense- Admin Operating Expense- Non-Admin 26.7 26.7 ABC Total Cost P Q 45 16 8 40 Q 87.7 74.7 Ardavan Asef-Vaziri 7
What Product to Produce? Cost World Solution. Finance View: Suppose you are the financial manager and are in favor of the product with more profit per unit. Standard Costing Sales Price Total Costs Gross Income P $90 $85 $5 Q $100 $80 $20 Q ABC Costing Sales Price Total costs Gross Income P $90 $87. 7 $74. 7 $2.3 Q $100 Q $25.3 Marginal Contribution P: Profit Margin = $90 - 45 Profit Margin= $45 Q: Profit Margin = $100-40 Profit Margin= $60 Q Ardavan Asef-Vaziri 8
What Product to Produce? Cost World Solution. Production View: Minutes of production or profit per minute of production time Q Q Product P Q A 15 10 B 15 30 C 15 5 D 15 5 Minutes Profit Margin Profit/Minute 60 45 0.75 50 60 1.2 For 50 units of Q, need 50 ( ) = min. on B, leaving min. on B, for product P. Each unit of P requires minutes on B. So, we can produce units of P. If we sell units of Q and units of P, we get 50( ) +60( ) = per week. After factoring in operating expense ($6,000), we LOSE $300! 1500 30 900 15 900/15 = 60 $45 50 60 $60 $5700 Ardavan Asef-Vaziri 9
1. Identify The Constraint(s. Can We Meet the Demand of 100 Ps and 50Qs? Can we satisfy the demand? Resource requirements for 100 P s and 50 Q s: Resource A: 100 minutes 100 + 50 + 50 15 = = 2000 10 30 3000 15 Resource B: 100 100 + 50 15 + 50 5 = = 1750 minutes 1750 15 5 Resource C: 100 100 + 50 + 50 = = minutes Ardavan Asef-Vaziri 10
Cost World Three shortcomings in the cost world: Costs can be reduced at most by what they are. Downsizing is a threat to workforce. Thinks locally; an increase in the cost of an engine of $30 would have decreased the cost of the transmission by $80. The center producing the engine is reluctant to do so. Instead of strengthening the weakest link (improving Throughput in the throughput world), we focus on improving efficiency at the current level of performance (improving Operating Expenses in the cost world). Chain of 10 links, each with carrying capacity of 100 lbs. except for one with only 50 lbs. Ardavan Asef-Vaziri 11
Cost World The enterprise is now locked into the current performance level; it now has ten links, any one of which can break. In the future, if improved performance is desired, it will have to work all ten links in the chain If business picks up, it will be harder to recruit employees due to the fear of being fired in the next downsize. Ardavan Asef-Vaziri 12
2. Throughput World -Exploit the Constraint: Find the Best Solution Resource B is Constraint - Bottleneck Product Q Profit Margin 60 Resource B (the bottleneck) needed 15 30 Profit per min of Bottleneck 45/15 =3 3 60/30 =2 2 P 45 Per unit of bottleneck Product P P creates more profit than Product Q Q Ardavan Asef-Vaziri 13
2. Exploit the Constraint : Find the Throughput World s Best Solution For 100 units of P, need 100 ( ) = min. on B, leaving min. on B, for product Q. 30 900/30 = 30 100 15 1500 900 Each unit of Q requires minutes on B. So, we can produce units of Q. 30 $60 $6300 $45 If we sell units of P and units of Q, we get 100( ) +30( ) = per week. After factoring in operating expense ($6,000), Profit: $300! Ardavan Asef-Vaziri 14
2. Exploit the Constraint : Find the Throughput World s Best Solution How much additional profit can we make if market for P increases from 100 to 102; by 2 units? We need 2(15) = 30 more minutes of resource B. Therefore, we need to reduce 30 minutes of the time allocated to Q and allocate it to P. For each unit of Q we need 30 minutes of resource B. Therefore, we produce one unit less Q For each additional P we make $45, but $60 is lost for each unit less of Q. Therefore, if the market for P is 102 our profit will increase by Ardavan Asef-Vaziri 15
Lessons Learned Link Performance of each subsystem (Marketing, Finance, Operations, etc) to the performance of the total system. Operating expenses including human recourses - are fixed costs. Do not treat them as variable costs. Do not assign them to the units of products. Decision should promote a growth strategy. Throughput World: Profit Maximization. Limited only by our imaginations. Think globally not locally. There is one or at most few constraint(s) determines limiting a system to achieve its best. Just like the links of a chain, the processes Ardavan Asef-Vaziri 16
The 5 Step TOC Focusing Process Step 1: Identify the System s Constraint(s) Step 2: Determine how to Exploit the System s Constraints Step 3: Subordinate Everything Else to that Decision Step 4: Elevate the System s Constraints Step 5: If a Constraint Was Broken in previous Steps, Go to Step 1 Performance of subsystems to be linked to the performance of the total system. The 5-Steps in a continuing Process. Ardavan Asef-Vaziri 17
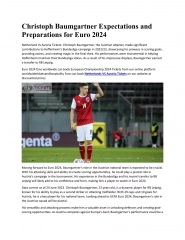
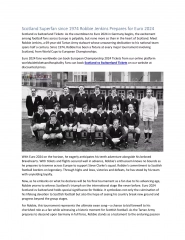
In Case If You Need to Practice $90 / unit 110 units / week $100 / unit 60 units / week Q: P: D D Purchased Part $5 / unit 10 min. 5 min. C B C 10 min. 5 min. 25 min. A B A 10 min. 15 min. 10 min. RM1 $20 per unit RM2 $20 per unit RM3 $25 per unit Time available at each work center: 2,400 minutes per week. Operating expenses per week: $6,000. All the resources cost the same. Ardavan Asef-Vaziri 18
1. Identify The Constraint(s) Contribution Margin: P($45), Q($55) Market Demand: P(110), Q(60) Product P Q Can we satisfy the demand? Resource requirements for 110 P s and 60 Q s: A 15 10 B 10 35 C 15 5 D 10 5 Resource A: 110 (15) + 60 (10) = 2250 minutes Resource B: 110(10) + 60(35) = 3200 minutes Resource C: 110(15) + 60(5) = 1950 minutes Resource D: 110(10) + 60(5) = 1400 minutes Ardavan Asef-Vaziri 19
2. Exploit the Constraint : Find the Throughput Worlds Best Solution Resource B is Constrained - Bottleneck Product Q Profit $ 55 Resource B needed (min) Profit per min of Bottleneck 45/10 =4.5 55/35 =1.6 55/35 =1.6 P 45 10 35 45/10 =4.5 Per unit of bottleneck Product P creates more profit than Product Q Produce as much as P, then Q Ardavan Asef-Vaziri 20
2. Exploit the Constraint : Find the World s Best Solution to Throughput For 110 units of P, need 110 (10) = 1100 min. on B, leaving 1300 min. on B, for product Q. Each unit of Q requires 35 minutes on B. So, we can produce 1300/35 = 37.14 units of Q. We get 110(45) +37.14(55) = 6993 per week. After factoring in operating expense ($6,000), we make $993 profit. $993 profit. Ardavan Asef-Vaziri 21
2. Exploit the Constraint : Find the World s Best Solution to Throughput How much additional profit can we make if market for P increases from 110 to 111; by 1 unit. We need 1(10) = 10 more minutes of resource B. We need to subtract 10 min of the time allocated to Q and allocate it to P. For each unit of Q we need 35 min of resource B. Our Q production is reduced by 10/35 = 0.29 unit. One unit increase in P generates $45. But $55 Ardavan Asef-Vaziri 22


")