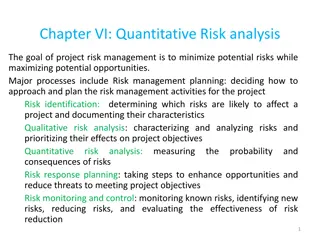
Effective Risk Management Strategies
"Learn about risk management procedures, tools, and practices for identifying, assessing, monitoring, and mitigating various types of risks. Explore different risk categories, internal and external risk factors, and strategies for managing financial, operational, and strategic risks in a comprehensive guide."

Download Presentation

Please find below an Image/Link to download the presentation.
The content on the website is provided AS IS for your information and personal use only. It may not be sold, licensed, or shared on other websites without obtaining consent from the author. If you encounter any issues during the download, it is possible that the publisher has removed the file from their server.
You are allowed to download the files provided on this website for personal or commercial use, subject to the condition that they are used lawfully. All files are the property of their respective owners.
The content on the website is provided AS IS for your information and personal use only. It may not be sold, licensed, or shared on other websites without obtaining consent from the author.
E N D
Presentation Transcript
Risk Management Presented by You Exec
Table of Contents I II Introduction Stakeholders Engagement Types of Risk Risk Categories Risk Identification Risk Appetite Risk Tolerance Risk Management Procedure III IV Tools & Practices Risk Planning Risk Identification Risk Assessment Risk Monitoring Risk Tracking Impact &Probability Analysis Risk Mitigation Strategies Qualitative Analysis Quantitative Analysis
Operational Strategic Cost Overrun Operational Controls Capacity management Supply Chain Issues Employee Issues incl. fraud Bribery and Corruption Commodity prices Demand Shortfall Customer retention Integration problems Pricing pressure Industry downturn JV or partner losses Types of Risks Macroeconomic Political Issues Legal Issues Terrorism Natural disasters Debt and interest rates Financial management Asset losses Goodwill and amortization Accounting problems Hazard Financial
Internal & External Risks Internal Risks External Risks Strategic Operational Enablers Demand Governance Access to Services People Regulatory Strategic Planning Processes Financial Economical Ethics & Values Business Interruption Technology Socio- Political Stakeholder Relations Emergency Response Infrastructure Environment
Risk Categories Product Design System/ Software Manufacturing All Other Quality Project Management Product Performance Data Accuracy Assembly Consumer service Team work Quality system Design Security Tools Environment Product cost Sigma Levels Your text here Your text here Your text here Your text here Your text here Your text here Your text here Your text here Your text here Your text here Your text here Your text here Your text here Your text here Your text here Your text here Your text here Your text here
Identification of Risk Categories Risk Category Financial Financial Operational Operational Strategic Strategic Customer Retention Demand Shortfall Funding Capacity Capacity Availability Risk Sub Category 2 3 3 4 5 5 Likelihood Risk level Profitable Growth Low Price Develop New product Leverage Technology Risk Score by Risk Category
Risk Severity Dial Medium This slide is 100% editable. Adapt it to your needs and capture your audience's attention. High Low This slide is 100% editable. Adapt it to your needs and capture your audience's attention. This slide is 100% editable. Adapt it to your needs and capture your audience's attention.
Stakeholders Engagement
Risk Appetite High Exceeding Risk Appetite Medium Impact Within Risk Appetite Obtain an estimate of the risk appetite of the shareholders with the help of the below bar graph. This will help in assessing the acceptable risk level Low Low Medium High Likelihood
Risk Tolerance Moderate High Very High Very Low Low 0.7 0.2 0.9 0.5 0.1 Insignificant increase 10- 20% cost increase 20- 25% cost increase Cost <10% cost increase > 25% cost increase Insignificant fall in schedule <7% schedule slippage 7-10% schedule slippage 10-15% schedule slippage 15-20% schedule slippage Schedule Insignificant scope decrease Minor areas of scope affected Major areas of scope affected Reduction unacceptable Project end item is useless Scope Only demanding applications are affected Barely noticeable degradation Reduction requires approval Reduction unacceptable Project end item is unusable Quality
Risk Tolerance Impact Loss of key managers Business continuity problems Supplier default IT problems Product or service quality Loss of key partnerships Poor project management Likelihood
Risk Management Procedure
Procedure for Managing Risks Risk Planning Risk Register Risk Monitoring Risk Tracking Risk Identification Risk Assessment
Risk Assessment Risk Rating Guide Impact Impact Probability Very High Low Med High Performance, quality, cost or safety impacts resulting in major redesign and program delay Major uncertainties remain No or little prior experience or data Infrastructure and/or resources not in place High (5) Very High Show stopper 1 3 5 R Some uncertainties remain Some experience and data exist Infrastructure in place but under-resourced Performance, quality, cost and/or safety impacts resulting in minor redesign and schedule adjustment Significant risk High 5 15 25 O Medium (3) 5 Proceed w/ caution Med 3 9 15 Y 3 Performance, quality, cost and safety requirements met within planned schedule Few uncertainties remain Significant experience and data exist Infrastructure in place and fully Low (1) Low 1 3 5 G No concern 1 Risk Scoring System Likelihood of Occurrence E. Probability of once in many years D. Probability of once in many operating months C. Probability of once in some operating weeks B. Probability of weekly occurrence A. Probability of daily occurrence Consequences Likelihood of Detection 1. No. direct effect on operating service level 2. Minor deterioration in operating service level 3. Definite reduction in operating service level 4. Source deterioration in operating service level 5. Operating service level approaches zero A. Detectability is very high B. Considerable warning of failure before occurrence C. Some warning of failure before occurrence D. Little warning of failure before occurrence E. Detectability is effectively zero
Risk Assessment (Cont.) Consequences Insignificant Minor Moderate Major Catastrophic Likelihood 1 2 3 4 5 A. Almost Certain - - - - - B. Likely - - - - - C. Possible - - - - - D. Unlikely - - - - - E. Rare - - - - - Extreme Risk High Risk Moderate Risk Low Risk Immediate Action where senior management get involved Management responsibility Should be specified Managed by specific responsible person Managed by routine process
Risk Register Probability Impact Type of Risk Description of Risk Risk Response Strategy Risk Owner H M L Perf. Cost Time Lack of acceptance by investor of design proposals Market observation, alternative designing solutions Design 50k-500k Investor Earlier diagnosis of the situation in local authorities offices, organization of meetings preceding designing process Delays and difficulties in obtaining opinions and permits Design 500k-2m Investor Conflict among designing team members Response of a team leader to all forms of conflicts mediation in a team Design 50k-500k Designer Office Proposing for employees to work overtime or ordering of part of work to another designing team Overly optimistic assessment of employee workload Design 50k-500k Designer Office Incorrect information from investors and lack of clear guidance Application to investor for extension of time to complete a design due to additional circumstances Design 2m-5m Investor Employment of new employees or ordering part of work to another party during a contract Acceptance of unrealistic deadlines in contact Time 2m-5m Designer Office Underestimation of design budget Limiting scope of design to necessary minimum. Budget 2m-5m Investor
Risk Management Plan Proposed risk treatment actions to mitigate risk Type of Risk Existing risk treatment actions in place Additional Resources Target Date Person Responsible Outcome Rating Detailed understanding of the market Performance Deterioration Proper assessment of underlying strategies John Smith Strategic risk 2 Your text here 31/4/2018 Detailed understanding of the market Performance Deterioration Proper assessment of underlying strategies John Smith Strategic risk 2 Your text here 31/4/2018 Detailed understanding of the market Performance Deterioration Proper assessment of underlying strategies John Smith Strategic risk 2 Your text here 31/4/2018 Detailed understanding of the market Performance Deterioration Proper assessment of underlying strategies John Smith Strategic risk 2 Your text here 31/4/2018
Risk Identification Cost Time Budget Exceeded Unanticipated Expenditure Schedule overruns Tasks omitted from Schedule Opportunity to compress Schedule Resources Identify Risks Communication Team is under-resourced Materials shortage Machinery unavailable Industrial Action Skills gap Poor communication (Stakeholder dissatisfaction) Positive & timely communications (positive publicity) Environmental Scope Bad weather results in re-work Weather delays progress Adverse effects occur Environmental approvals not complied with Scope creep Scope poorly defined Project changes poorly managed
Risk Identification How Long Can You Do Without? Contingency in case of a disaster? Impact of Doing Without? Vulnerabilities? Use paper reports for 5 days then go manual for as many members as possible Equipment (IT only) After five days no way to schedule production or track orders No UPS/ generator, MD hardware, SPOF SME 5 days Look for warehouse space, attempt to salvage equipment and restart operation, file bankruptcy Metal building, flood zone, poor maintenance, no perimeter security, door lock broken No production, potential for bankruptcy, IT non- existent Facility 0 days Degraded operations, low service levels Best effort shifting of available staff, temps Personnel 0 days Too many SPOF 30 days before new deliveries Raw Materials None until on hard exhausted Single supplier relationship Search for alternatives supplier Transportation System 30 days in 2 days out No suppliers, No deliveries Location, design of entrance None Extrusion shuts down, lines cleaned, waste collected and prepared for grinder, IT non-existent 0 hours/power 0 hours/water Single power feed, no generator or backup water supply Utilities None Vendors (Sourcing) 4 hours No call center Mercy of vendor Being in-house
Risk Analysis Complex Additional Control (Detail additional to be implemented Controls) Risk Analysis Risk Analysis (with additional controls) Control Measures (Detail any existing Controls) Description of Risk C L Risk Rating C L Risk Rating Step 1: Consider Step 2: Consider Likelihood Step 3: Calculation Risk 1. 2. 3. Take Step 1 rating and select correct column 2. Take Step 2 rating and select correct row 3. Use the risk score where the two ratings cross on the matrix below. H = High, S = Serious, M = Medium, L = Low What is the consequence of the hazard occurring. Consider what is the most possible consequence with respect to work What is the likelihood of the hazard consequences occurring in Step1 Safety at work Regulatory Non compliance Almost Is expected to occur in most Sickness Extreme Certain Circumstances (once per year) Min Maj Crit Ext Casualty Critical Major non compliance Likely Will probably occur once (every 5 year) S(A4) S(A3) H(A2) H(A1) Almost Certain Likelihood Possible Event might occur at some time (10years) M(B4) S(B3) H(B2) H(B1) Likely Medical treatment Major Warning L(C4) M(C3) S(C2) S(C1) Possible Unlikely/ Rare Event expected to occur only in exceptional circumstances (20+ years) Minor non compliance L (D4) M(D3) M(D2) S(D1) Unlikely Rare Minor First aid
Risk Analysis Simplified Impact to Project if Risk Item Does Occur Priority (Likelihood * Impact) Risk Items (Potential Future Problems Derived from Brainstorming) Likelihood of Risk Item Occurring New operating system may be unstable 10 10 100 Communication problems over system issues 8 9 72 We may not have the right requirements 9 6 54 Requirements may change late in the cycle 7 7 49 Database software may arrive late 4 8 32 Key people might leave 2 10 20
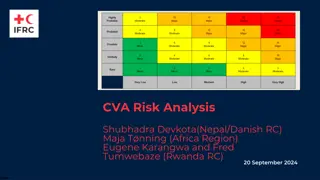
Almost Certain Medium Risk High Risk Risk Matrix High Risk Use the Risk Matrix during risk assessment to define the level of risk by considering the category of probability or likelihood against the category of consequence severity. This is a simple mechanism to increase visibility of risks and assist management decision making. Possible Medium Risk High Risk Low Risk Rare Low Risk Low Risk Medium Risk Significant Insignificant Moderate
Risk Response Matrix Who is responsible Risk Event Response Contingency Plan Trigger Mitigate: Test prototype Work around until help comes Interface Problems Not solved within 24 hours John Mitigate: Test prototype System Freezing Reinstall OS Still frozen after one hour Louise Mitigate: Test Demonstration User Backlash Increase Staff Support Call from top management Helen Mitigate: Select Reliable Vendor Transfer: Warranty Hardware Malfunctioning Order replacement Equipment fails Tom
Risk Tracker Description of Risk ID Impact Risk Response Risk Level Risk Owner Notes Confirm delivery dates by Phase 2 1 Supplier Delay Pushes Launch High John Add notes here 2 Factory Availability Cost Overruns Stakeholder trip to China High Dave Add notes here Steering Committee Unavailable Delay Launch Marketing Define Marketing Plans in March 3 Low Carey Add notes here 4 5 6 7 8 9 10 11
Risk Item Tracking Monthly Ranking Risk Items Risk Resolution This Month # of Months Last Month Inadequate Planning 1 2 4 Working on revising the entire project plan Holding meetings with project customer and sponsor to clarify scope Poor Definition of Scope 2 3 3 Just assigned a new project manager to lead the project after old one quit Absence of leadership 3 1 2 Poor Cost Estimates 4 4 3 Revisiting cost estimates Poor time Estimates 5 5 3 Revisiting schedule estimates
Tools & Practices Quantitative Analysis Impact & Probability Analysis Qualitative Analysis Risk Mitigation Strategies
Risk Impact & Probability Analysis Impact Cost Time Quality Manageable by exchange against Internal budgets Slight slippage against internal targets Slight reduction in quality/scope, no overall impact Very Low Require some additional funding from Institution Slight slippage against key milestones or published targets Failure to include certain nice to have elements Low Requires Significant additional funding from Institution Delay affects key stakeholders loss of confidence in the project Significant elements of scope for functionality will be unavailable. Medium Requires Significant reallocation of Institutional funds (or borrowing) Failure to meet key deadlines in relation to academic year or strategic plan Failure to meet the needs of a large proportion of stakeholders High Increases threaten viability of project Delay jeopardizes viability of project Project outcomes effectively unusable Very High
Risk Mitigation Strategies 1 Technical Risks Emphasize team support and avoid stand- alone project Structure Increase project manager authority Improve problem handling and communication Increase the frequency of project monitoring 2 Cost Risks Increase frequency of project monitoring Improve communication, project goals understanding, and team support Increase project manager authority 3 Schedule Risks Increase the frequency of project monitoring Select the most experienced project manager
Risk Mitigation Plan Monitor any updates on popular web browser and / or bootstrap and make sure all UI design works as intended on updated web browsers or responsive bootstrap Update client more frequently along the way with project progress Perform periodical check on server status Client Management Identified Risk Server Technical Identified Risk Identified Risk Miscommunication with sponsor or client regarding project requirement and expectations Server is down which causes project to be slightly delayed due to application not able to load Popular web browsers may get an update that will discontinue support for features used in our development as we using responsive bootstrap.
Qualitative Risk Analysis Impact 1 2 3 4 5 Probability Negligible Minor Moderate Significant Severe Low Risk Moderate Risk High Risk (81-100)% Extreme Risk Extreme Risk Low Risk Moderate Risk High Risk (61-80)% Minimum Risk Extreme Risk Low Risk Moderate Risk High Risk High Risk (41-60)% Minimum Risk Low Risk Low Risk Moderate Risk High Risk (21-40)% Minimum Risk Low Risk Moderate Risk High Risk (1-20)% Minimum Risk Minimum Risk Project Risk (Threat & Opportunity) Matrix: Any Risk with a probability of over 80% will be treated as a fact and will be addressed in the Project Management Plan and not in Risk management. Risk Threshold( which risks move forward) in the process and which one will be
Quantitative Risk Analysis Risk Title & Description Due Date Total Score Mitigation Actions Contingency Plan Resp. Cat. Rating Prob. Impact Cost Risk Insufficient funds to support the bid Borrow money from the bank or investor to fund the effort Find a partner to help share costs ABC 5/31 Cost High .80 4 3.20 Schedule Risk Borrow additional proposal staff from another division Hire additional proposal staff or consultants BMC 6/1 Sched. Low .55 4 2.20 Insufficient resources to finish work on time Risk Probability values are between 0.1 (Remote Chance) 1.0 (Certain) Risk Score = Probability * Impact Risk Impact values are between 1 (insignificant) - 4 (Unable to meet objectives) Risk Score values are between 1-4 (with 4 being the highest risk) or red, yellow, green, blue.


")