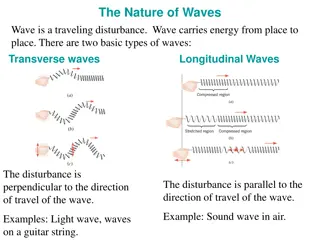
Effective Student Performance Tracking Using Longitudinal Reports
Discover how to track student performance over time with the Longitudinal Report Reporting System. Learn how to customize and interpret longitudinal reports to support schools in achieving academic success for students. Gain insights into individual and group performance trends, modify test groups, filter test opportunities, switch between score data and performance level data, and see performance in different areas over time.

Download Presentation

Please find below an Image/Link to download the presentation.
The content on the website is provided AS IS for your information and personal use only. It may not be sold, licensed, or shared on other websites without obtaining consent from the author. If you encounter any issues during the download, it is possible that the publisher has removed the file from their server.
You are allowed to download the files provided on this website for personal or commercial use, subject to the condition that they are used lawfully. All files are the property of their respective owners.
The content on the website is provided AS IS for your information and personal use only. It may not be sold, licensed, or shared on other websites without obtaining consent from the author.
E N D
Presentation Transcript
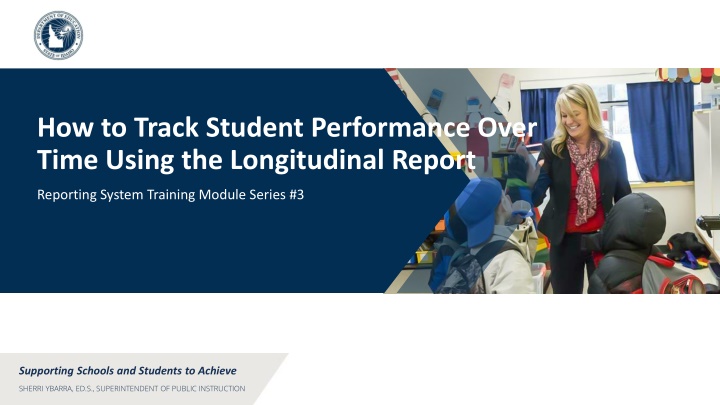
How to Track Student Performance Over Time Using the Longitudinal Report Reporting System Training Module Series #3 Supporting Schools and Students to Achieve SHERRI YBARRA, ED.S., SUPERINTENDENT OF PUBLIC INSTRUCTION
What Does the Longitudinal Report Look Like? An Individual Student Who Took Related Tests Multiple Students Who Took Related Tests with Multiple Reporting Categories 3
Progression Options Feature Drop-down options are: Summatives Interims Both Only students highlighted in yellow will appear on the Longitudinal Report 4
Filter Test Opportunities to Show Some and Not Others School Year: By default, data is shown for all years. Selecting a date, such as 2019, will filter the results for the 2019 2020 school year results. Test Reason: Most helpful for numerous interim and benchmark tests that can be screened by category, omitting those you do not need to see. Test reasons for summative tests are determined by administration date, typically the end of the school year or the course. Test Label: Deselect the names of the tests you don t need to see. 7
Switch Between Score Data & Performance Level Data 8
Longitudinal ReportsWays to Customize Results from current & previous school years Results for current & former students Filter options: school year, test reason, test label INDIVIDUAL REPORTS GROUP REPORTS Multiple instances of the same test (interims and benchmarks) Related tests (typically related by standard and determined by school/district administration) Students who completed the same test multiple times (interims and benchmarks) Students who completed related tests 10
The Reporting System Training Module Series 1. How to Navigate the Dashboard and Generate Reports 2. How to Drill Down into Your Results Using Settings and Filters 3. How to Track Student Performance Over Time Using the Longitudinal Report 4. How to Print ISRs and Student Data Files 5. How to Print and Export Data You Can See in Your Reports 6. How to Use the Roster Manager to Add, Modify, and Upload Rosters Interim and Benchmark Assessments Only 7. How to Analyze Item-Level Reports 8. How to Hand-Score Unscored Items and Modify Machine Scores 11