Effective Ways to Identify Community Needs and Demographics
Discover three key methods for identifying community needs and demographics: leveraging existing knowledge, utilizing demographic data, and conducting your own research or consultations. Explore the importance of demographics in understanding communities and learn how to access valuable statistics and resources to inform decision-making and address community needs effectively.

Uploaded on | 0 Views
Download Presentation

Please find below an Image/Link to download the presentation.
The content on the website is provided AS IS for your information and personal use only. It may not be sold, licensed, or shared on other websites without obtaining consent from the author. If you encounter any issues during the download, it is possible that the publisher has removed the file from their server.
You are allowed to download the files provided on this website for personal or commercial use, subject to the condition that they are used lawfully. All files are the property of their respective owners.
The content on the website is provided AS IS for your information and personal use only. It may not be sold, licensed, or shared on other websites without obtaining consent from the author.
E N D
Presentation Transcript
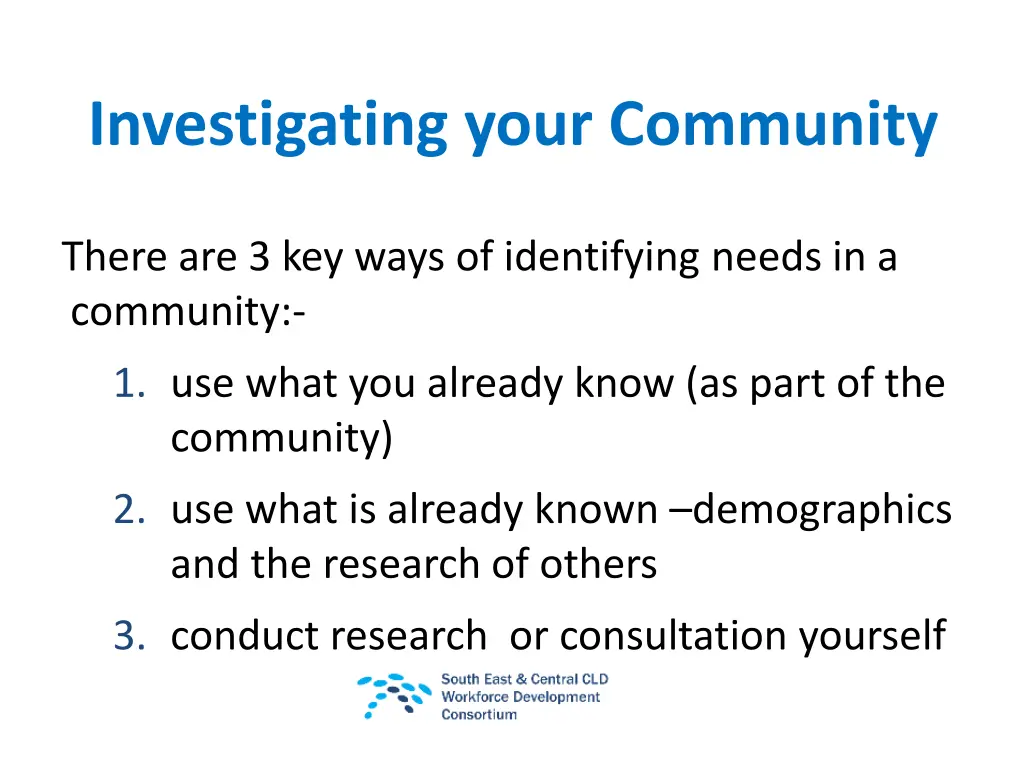
Investigating your Community There are 3 key ways of identifying needs in a community:- 1. use what you already know (as part of the community) 2. use what is already known demographics and the research of others 3. conduct research or consultation yourself
demographics characteristics and statistics of human population: the characteristics of a human population or part of it Including information on population Size Age Sex Health Education Employment
Demographics are most useful for looking at areas communities of place Different ways areas are defined:- Local Authority Settlement towns and some villages Council Wards - Multi-member or pre-2007 wards Intermediate zones within a ward and contain between 2,500 and 6,000 household residents Datazones Scotland is divided into 6505 datazones (each averaging around 750 people) Postcodes although usually considered too small
www.scrol.gov.uk Choose a topic Population Education Household Health Employment Can search by different types of areas
Statistics are really only useful when you can compare them to something else
Scottish Neighbourhood Statistics the Scottish Governments website to improve the availability, consistency and accessibility of statistics in Scotland.
www.sns.gov.uk quick profile Topics covered in the quick profile include Economic activity, benefits and tax credits Health Education training and skills Housing Index of deprivation Crime and justice Physical environment Population Access to services
Comparative Health Profiles 2010 (and 2008) ScotPHO - return to homepage http://www.scotpho.org.uk/home/Comparativehealth/Profiles /2010CHPProfiles.asp The 2010 health profiles are now available, along with complementary profiles focussing on children and young people. These profiles highlight the considerable variation in health between areas and help identify priorities for health improvement. The profiles give a snapshot overview of health for each area using spine charts (which show how the area compares to the Scottish average), and allow further understanding of the results via rank charts and trend charts. Information is available for NHS boards, CHPs/local areas* and small areas (Intermediate Zones)
SIMD http://www.scotland.gov.uk/Topics/Statistics/SIMD Overview The Scottish Index of Multiple Deprivation identifies small area concentrations of multiple deprivation across all of Scotland in a consistent way. The SIMD is presented at data zone level, enabling small pockets of deprivation to be identified. The data zones, which have a average population size of 769, are ranked from most deprived (1) to least deprived (6,505) on the overall SIMD and on each of the individual domains.
Scottish Schools On-line http://www.ltscotland.org.uk/scottishschoolsonline/index.asp For Primary Schools HMIE school reports Attendance and absence Free school meals For Secondary Schools HMIE school reports Fourth year exam results Fifth year staying on rates and exam results Sixth year staying on rates and exam results Attendance and absence Leaver destinations Free school meals
nomis - official labour market statistics https://www.nomisweb.co.uk/ gives access to the most detailed and up-to-date UK labour market statistics from official sources Data presented by Local Authority, ward area and Scottish Parliamentary Constituencies Includes data on population, employment, unemployment, qualifications, earnings, benefit claimants and businesses.
Scottish Government Statistics http://www.scotland.gov.uk/Topics/Statistics
researching demographics on-line Some key things to remember:- Statistical information about an area is most useful when compared to something else eg. a larger area that it is part of, an area of similar size elsewhere or another time The age of the data is important Logic and local knowledge can help judge whether the data still has comparative value Statistics can be misleading make sure you can always understand them in terms of real people watch out for tricks caused by percentages and numerical standardisation If you don t fully understand it, don t use it It is helpful to know what you are looking for, and what you will use the information for, before you start Saves following trails of possibly interesting but not necessarily useful data