Effects of Habitat and Geography on Bird Species Richness
Explore how species richness of birds is influenced by habitat types, latitude, and longitude in various geographical locations. The study reveals correlations between forest cover, coastal proximity, and bird diversity. Detailed surveys from different sites provide insights into the distribution patterns of bird species across diverse habitats.

Download Presentation

Please find below an Image/Link to download the presentation.
The content on the website is provided AS IS for your information and personal use only. It may not be sold, licensed, or shared on other websites without obtaining consent from the author. If you encounter any issues during the download, it is possible that the publisher has removed the file from their server.
You are allowed to download the files provided on this website for personal or commercial use, subject to the condition that they are used lawfully. All files are the property of their respective owners.
The content on the website is provided AS IS for your information and personal use only. It may not be sold, licensed, or shared on other websites without obtaining consent from the author.
E N D
Presentation Transcript
There will be greater species richness at the longitudes closer to the coast line. There will be more species of birds where there is a greater proportion of forest land-cover.
The latitude points were kept at +-5 of 40N to limit the effect of latitudinal factors. The longitudes ranged from -105.72 and -74.06 to show the inland and costal effects on species richness.
Site Point State Latitude Longitude Surveys per Year Years Surveyed Bird Species NE Iowa 16-A Iowa 43.455 -91.349 6 2 25 Ozark-St. Francis Nat. Forest A Arkansas 35.817 -93.073 5 3 5.6 KY Fish and Wildlife PSF-17 Kentucky 37.098 -87.668 11 11 11.8 Missouri Private Lands Restoration Site Drake 1 Missouri 36.671 -91.823 9 3 3 Horicon NWR 10Wisconsin 43.616 -88.673 3 3 15 38.988 -85.453 Big Oak NWK BBS-D Indiana 1 1 12 38.903 -85.425 Big Oak NWK BBSA12 Indiana 7 7 8 38.936 -85.43 Big Oak NWK BBSA17 Indiana 7 7 9 38.869 -85.442 Big Oak NWK BBSCO6 Indiana 6 7 14 39.038 -85.424 Big Oak NWK BBSD13 Indiana 6 7 8 Edwin B. Forsythe NWR 40.039 -74.088 9 10 6.2 73New Jersey Edwin B. Forsythe NWR 40.042 -74.061581 4 5 5.6 75New Jersey Erie NWR GLSL20 41.571 -79.976 6 13.5 Pennsylvania 23 Ohio River Islands NWR ORIN50 39.886 -80.79 5 7.6 West Virgina 5 Ohio River Islands NWR ORIN46 39.89 -80.795 5 8.2 West Virgina 5 Upper Mississippi River 201-1 43.64 -91.58 Iowa 2 2 9.5 Fergus Falls WMD aga-2 46.28 -96.24 Minnesota 1 1 6 Squaw Creek Wet Prarie 01 37.25 -95.77 Kansas 9 4 8.5 Neal Smith NWR 41.6 -93.3 8 3.5 1Iowa 7 Hamden Slough NWR 46.89 -95.95 11 4.25 1Minnesota 8 Rocky Mt. National Park 40.35 -105.6 6 9 8 101Colorado Rocky Mt. National Park 40.362 -105.8 9 9 6 220Colorado Rocky Mt. National Park 40.218 -105.537 2 9 11 1201Colorado Rocky Mt. National Park 40.404 -105.721 9 9 6 601Colorado Rocky Mt. National Park 40.427 -105.5 8 8 5 4211Colorado
Forest Non-Forested Wetland Agricultural Residential 1.00 0.00 0.00 0.00 1.00 0.00 0.00 0.00 0.99 0.00 0.00 0.00 0.44 0.00 0.56 0.00 0.00 0.00 0.00 0.00 0.95 0 0.05 0 0.98 0 0.01 0.01 0.93 0 0.07 0 0.99 0 0.01 0 0.97 0 0.03 0 0.96 0 0 0.03 0.25 0.2 0.04 0.5 0.56 0.04 0.36 0.06 0.39 0.13 0 0.48 0.49 0.4 0.12 0.12 0.93 0 0.04 0.03 0 0.03 0.97 0 0.11 0.06 0.71 0.12 0 0.02 0.68 0.3 0.1 0.21 0.62 0.07 0.29 0.47 0.24 0 0.7 0 0.09 0 0.9 0.03 0.07 0 0.1 0 0.82 0.03 0.8 0 0.2 0
Forest3 Non-Forested Wetland4 Agricultural5 Residential6 0.66 0.00 0.31 0.03 0.99 0.00 0.01 0.00 0.38 0.02 0.52 0.08 0.44 0.00 0.55 0.01 0.14 0.01 0.83 0.02 0.7 0 0.27 0.02 0.87 0 0.12 0.015 0.86 0 0.12 0.02 0.73 0 0.25 0.02 0.93 0.01 0.05 0.01 0.21 0 0.15 0.65 0.95 0.39 0.47 0.09 0.51 0.05 0.3 0.14 0.63 0.1 0.07 0.21 0.63 0.1 0.07 0.21 0.39 0 0.57 0.03 0 0.05 0.93 0.01 0.11 0.32 0.5 0.08 0.01 0 0.95 0.04 0.1 0.12 0.76 0.02 0.68 0.02 0.26 0.04 0.55 0.01 0.07 0.01 0.86 0 0.12 0.01 0.49 0 0.26 0.03 0.72 0 0.27 0
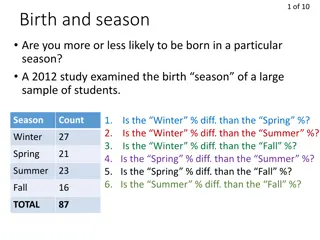
Species Richness vs Longitude 30 25 20 Species Richness 15 10 5 0 70 75 80 85 90 95 100 105 110 Longitude
Local scale 5.5 Km2 30 25 20 Species Richness 15 10 5 0 0.00 0.20 0.40 0.60 0.80 1.00 1.20 Proportional Land Use Forest
Regional Scale 65Km2 30 25 20 Species Richness 15 10 5 0 0.00 0.20 0.40 0.60 0.80 1.00 1.20 Proportional Land Use Forest
Species richness of avian species decreases as distance from the coast increases. For both local and regional scales, species richness increases with larger proportion forest land use.
Date used=10/10/10 (MRLC) http://www.mrlc.gov/index.php Date used=10/10/10 (Bird Count) http://137.227.242.103/point/


")