Effects of Semaglutide on KDIGO Risk Category in Type 2 Diabetes and CKD Participants
Explore the impact of semaglutide treatment on KDIGO risk category in individuals with type 2 diabetes and chronic kidney disease, as studied in the FLOW trial. The analysis includes changes in UACR, eGFR, and risk of kidney events over a 104-week period. Discover the potential benefits for this patient population.
Download Presentation

Please find below an Image/Link to download the presentation.
The content on the website is provided AS IS for your information and personal use only. It may not be sold, licensed, or shared on other websites without obtaining consent from the author. If you encounter any issues during the download, it is possible that the publisher has removed the file from their server.
You are allowed to download the files provided on this website for personal or commercial use, subject to the condition that they are used lawfully. All files are the property of their respective owners.
The content on the website is provided AS IS for your information and personal use only. It may not be sold, licensed, or shared on other websites without obtaining consent from the author.
E N D
Presentation Transcript
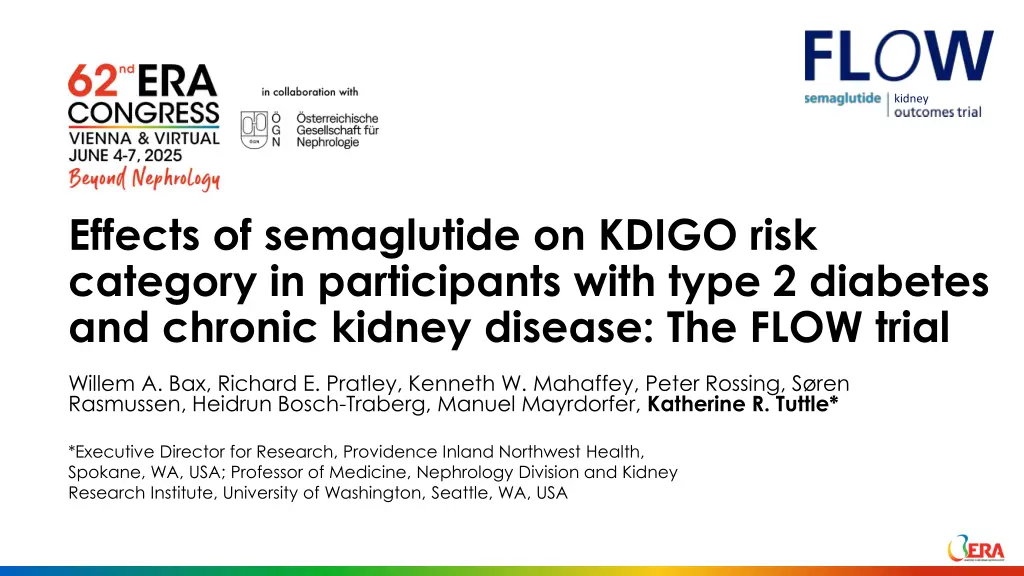
kidney Effects of semaglutide on KDIGO risk category in participants with type 2 diabetes and chronic kidney disease: The FLOW trial Willem A. Bax, Richard E. Pratley, Kenneth W. Mahaffey, Peter Rossing, S ren Rasmussen, Heidrun Bosch-Traberg, Manuel Mayrdorfer, Katherine R. Tuttle* *Executive Director for Research, Providence Inland Northwest Health, Spokane, WA, USA; Professor of Medicine, Nephrology Division and Kidney Research Institute, University of Washington, Seattle, WA, USA
Disclosures Consultation and research on therapeutics for diabetes and kidney disease: Eli Lilly and Company Boehringer Ingelheim Bayer Novo Nordisk Travere ProKidney The FLOW trial was sponsored by Novo Nordisk.
Background In the FLOW trial, OW s.c. semaglutide 1.0 mg reduced the risk of major kidney disease events, CV events and all-cause death in participants with T2D and CKD These analyses assessed effects of semaglutide versus placebo on: KDIGO risk category* UACR change by KDIGO risk category *Post hoc analysis; Prespecified analysis. CKD, chronic kidney disease; CV, cardiovascular; T2D, type 2 diabetes; KDIGO, Kidney Disease Improving Global Outcomes; OW, once weekly; s.c., subcutaneous; UACR, urine albumin:creatinine ratio.
FLOW trial design A multinational, randomised, controlled clinical trial1 Key eligibility criteria Once-weekly s.c. semaglutide 1.0 mg + standard of care Adults with T2D, HbA1c 10% RAAS inhibitor R eGFR 50 and 75 mL/min/1.73 m2 and UACR >300 and <5000 mg/g OR eGFR 25 and <50 mL/min/1.73 m2 and UACR >100 and <5000 mg/g 1:1 N=3533 Placebo + standard of care Early trial cessation was recommended at a prespecified interim analysis for efficacy at Event-driven treatment period ( 854 first primary outcome events) ~570 events Follow-up 5 weeks eGFR was calculated using the CKD-EPI (2009) formula. CKD-EPI, Chronic Kidney Disease Epidemiology Collaboration; eGFR, estimated glomerular filtration rate; HbA1c, glycated haemoglobin; R, randomization; RAAS, renin angiotensin aldosterone system; s.c., subcutaneous; T2D, type 2 diabetes; UACR, urine albumin:creatinine ratio. 1. Perkovic V et al. N Engl J Med 2024;391:109 121.
Methods Primary trial outcome1 For this analysis Time to first occurrence of major kidney events consisting of: Proportion of participants moving to a higher or lower KDIGO risk category from baseline to week 104 Sub-analyses of whether the change in KDIGO score was due to change in eGFR, UACR, or both Onset of persistent 50% reduction in eGFR compared with baseline Kidney failure: Onset of persistent eGFR <15 mL/min/1.73 m2 UACR ratio to baseline at week 104 by baseline KDIGO risk Initiation of chronic kidney replacement therapy (dialysis or kidney transplantation) UACR responder analysis ( 20% reduction) from baseline at week 104 Subgroup analyses by baseline KDIGO risk category Kidney death CV death eGFR was calculated using the CKD-EPI (2009) formula. CV, cardiovascular; eGFR, estimated glomerular filtration rate; KDIGO, Kidney Disease Improving Global Outcomes; UACR, urine albumin:creatinine ratio. 1. Perkovic V et al. N Engl J Med 2024;391:109 121.
FLOW included people with T2D at high and very high risk of CKD progression and CV events T2D CVD HbA1c: 7.8% T2D duration 15 years: 56.8% BP: 139/76 mmHg Prior MI or stroke: 22.9% Heart failure: 19.2% Age: 66.6 years Female: 30.3% BMI: 32.0 kg/m2 eGFR: 47.0 mL/min/1.73 m Median UACR: 567.6 mg/g RAAS inhibitor: 95.3% SGLT2 inhibitor: 15.6% CKD Medication use BMI, body mass index; BP, blood pressure; CKD, chronic kidney disease; CV, cardiovascular; CVD, cardiovascular disease; eGFR, estimated glomerular filtration rate; HbA1c, glycated haemoglobin; MI, myocardial infarction; RAAS, renin-angiotensin-aldosterone system; SGLT2, sodium glucose co-transporter-2; T2D, type 2 diabetes; UACR, urine albumin:creatinine ratio Perkovic V et al. N Engl J Med 2024;391:109 121.
KDIGO heatmap for risks of CKD Albuminuria categories Description and range A1 A2 A3 Normal to mildly increased Moderately increased Severely increased Moderately increased risk Low risk CKD is classified based on: Cause GFR (G) Albuminuria (A) High risk Very high risk <30 mg/g <3 mg/mmol 30 300 mg/g 3 30 mg/mmol >300 mg/g >30 mg/mmol G1 Normal or high 90 1 (<0.1) 7 (0.2) 23 (0.6) GFR categories (mL/min/1.73 m2) 93% were at high or very high risk Risks: Loss of kidney function Kidney failure CVD events Death G2 Mildly decreased 60 89 24 (0.7) 173 (4.9) 491 (13.9) Description and range Mildly to G3a 45 59 37 (1.0) 324 (9.2) 694 (19.6) moderately decreased Moderately to severely decreased G3b 30 44 40 (1.1) 414 (11.7) 905 (25.6) G4 Severely decreased 15 29 7 (0.2) 87 (2.5) 306 (8.6) G5 Kidney failure <15 Increased risk Data are n (%) for each category. CKD, chronic kidney disease; CVD, cardiovascular disease; GFR, glomerular filtration rate. de Boer IH et al. Diabetes Care 2022;45:3075 3090; Kidney Disease: Improving Global Outcomes (KDIGO) Diabetes Work Group. Kidney Int 2022;102:S1 S127. Rossing P et al. Nephrol Dial Transplant 2023;38:2041 2051.
Overall baseline characteristics by baseline KDIGO risk category Low/moderate risk (n=242) High risk (n=878) Very high risk (n=2412) Age, years 67.0 (61.0, 72.0) 67.0 (61.0, 72.0) 68.0 (61.0, 73.0) Sex, female 36.8% 27.9% 30.5% Body weight, kg 87.0 (75.0, 100.2) 89.6 (75.8, 103.1) 87.0 (74.7, 102.2) BMI, kg/m2 31.0 (27.3, 35.3) 31.5 (27.9, 35.5) 31.2 (27.4, 35.5) HbA1c, % 7.6 (6.9, 8.4) 7.7 (6.9, 8.7) 7.6 (6.8, 8.6) eGFR, mL/min/1.73 m2 66.0 (61.0, 75.0) 62.0 (51.0, 70.0) 39.0 (32.0, 46.0) UACR, mg/g 137.7 (28.3, 222.3) 408.3 (171.4, 985.8) 735.0 (346.1, 1566.1) SBP, mmHg 137.0 (128.0, 145.0) 137.0 (128.0, 148.0) 138.0 (128.0,148.0) DBP, mmHg 77.0 (70.0, 82.0) 78.0 (71.0, 84.0) 77.0 (69.0, 83.0) Data are median (IQR) or percentage of the population (%). P values were calculated by Kruskal-Wallis test for continuous variables, and by Cochran-Mantel-Haenszel test for binary variables. BMI, body mass index; DBP, diastolic blood pressure; eGFR, estimated glomerular filtration rate; HbA1c, glycated haemoglobin; IQR, interquartile range; KDIGO, Kidney Disease Improving Global Outcomes; Kidney Disease Improving Global Outcomes; SBP, systolic blood pressure; UACR, urine albumin:creatinine ratio.
Participants moving to a higher KDIGO risk category OR (95% CI) for moving to a higher KDIGO risk category during trial: 0.54 (0.42, 0.69) 0.54 (0.32, 0.90) 0.54 (0.41, 0.71) N/A (N/A)* 100 Proportion of participants moving 11.0 to a higher KDIGO risk category 16.1 from baseline to week 104 (%) 90 33.8 39.8 80 49.1 54.6 70 60 P<0.0001 50 40 P<0.0001 30 P=0.0183 20 10 0 Semaglutide n=1766 Placebo n=1766 Semaglutide n=123 Placebo n=119 Semaglutide n=432 Placebo n=446 Semaglutide n=1211 Placebo n=1201 Overall Low/moderate risk High risk Very high risk ORs were calculated by logistic regression with treatment and baseline use of SGLT2 inhibitor as fixed factors in each KDIGO risk category separately (low/moderate, high risk, very high risk). At week 104, 20% of participants in the semaglutide group and 18% in the placebo group had missing KDIGO scores: these values were imputed using the last observation carried forward. *By definition, participants in the KDIGO very high risk category could not move to higher risk category. One participant in the semaglutide group had a missing eGFR value at baseline. CI, confidence interval; eGFR, estimated glomerular filtration rate; KDIGO, Kidney Disease Improving Global Outcomes; SGLT2i, sodium glucose co-transporter-2; OR, odds ratio.
Participants moving to a lower KDIGO risk category OR (95% CI) for moving to a lower KDIGO risk category during trial: 1.70 (1.39, 2.07) 1.65 (0.57, 4.73) 1.75 (1.20, 2.54) 1.71 (1.34, 2.17) 100 Proportion of participants moving to a lower KDIGO risk category from baseline to week 104 (%) 90 80 70 60 50 P=0.0035 P<0.0001 P<0.0001 40 P=0.3533 30 20 19.0 10 16.3 16.4 11.9 10.4 10.3 8.1 5.0 0 Semaglutide n=1766* Placebo n=1766 Semaglutide n=123 Placebo n=119 Semaglutide n=432 Placebo n=446 Semaglutide n=1211 Placebo n=1201 Overall Low/moderate risk High risk Very high risk ORs were calculated by logistic regression with treatment and baseline use of SGLT2 inhibitor as fixed factors in each KDIGO risk category separately (low/moderate, high risk, very high risk). At week 104, 20% of participants in the semaglutide group and 18% in the placebo group had missing KDIGO scores: these values were imputed using the last observation carried forward. *One participant in the semaglutide group had a missing eGFR value at baseline. CI, confidence interval; eGFR, estimated glomerular filtration rate; KDIGO, Kidney Disease Improving Global Outcomes; SGLT2i, sodium glucose co-transporter-2; OR, odds ratio.
UACR ratio to baseline at week 104 by KDIGO risk category Overall Subgroup UACR ratio to baseline at week 104 Overall KDIGO risk category Low/moderate risk High risk Very high risk Interaction p value ETR (95% CI) 0.68 (0.62, 0.75) 0.67 (0.48, 0.96) 0.57 (0.48, 0.69) 0.72 (0.64, 0.81) 0.1108 0.4 0.8 ETR (95% CI) 1.0 1.6 Favours semaglutide 1.0 mg Favours placebo Subgroup analyses were performed by analysis of covariance with treatment, subgroup, and interaction between treatment, baseline use of SGLT2 inhibitor and subgroup as fixed factors; baseline value was used as a covariate. UACR ratio to baseline and the corresponding baseline value were log-transformed prior to analysis. The complete data sets were analysed and the results combined using Rubin s rule. CI, confidence interval; ETR, estimated treatment ratio; KDIGO, Kidney Disease Improving Global Outcomes; SGLT2i, sodium glucose co-transporter-2; UACR, urine albumin:creatinine ratio.
UACR response at week 104 Overall risk of a UACR response ( 20% UACR reduction at week 104) UACR response by baseline KDIGO risk category Overall Interaction OR p Semaglutide n (%) Placebo n (%) Subgroup ETR (95% CI) p value (95% Cl) value UACR response ( 20% reduction from baseline) 20% reduction in UACR at week 104 Overall 1.74 (1.52, 1.99) KDIGO risk subgroup 813 (46.0) 1057 (59.9) No Low/moderate risk 1.59 (0.95, 2.68) High risk 2.09 (1.59, 2.73) 0.3174 Very high risk 1.65 (1.40, 1.94) 953 (54.0) 709 (40.1) 1.74 Yes <0.0001 (1.52, 1.99) 0.5 1 2 4 Favours semaglutide 1.0 mg ETR (95% CI) Favours placebo The last UACR measurement up to and including week 104 was carried forward to week 104. Analyses for overall risk of a UACR response were calculated by logistic regression with treatment and baseline use of SGLT2 inhibitor as fixed factors, and baseline UACR as a covariate. ORs are for semaglutide 1.0 mg vs. placebo for a 20% reduction vs. a <20% reduction in UACR. Subgroup analyses were performed by logistic regression with treatment, subgroup, and interaction between treatment, baseline use of SGLT2i and subgroup as fixed factors; baseline value was used as a covariate. Data are from the in-trial period. CI, confidence interval; ETR, estimated treatment ratio; KDIGO, Kidney Disease Improving Global Outcomes; OR, odds ratio; SGLT2i, sodium glucose co-transporter-2; UACR, urine albumin:creatinine ratio.
Conclusions In the FLOW trial, participants with T2D and CKD had a lower likelihood of progression to higher KDIGO risk categories and a higher likelihood of regression to lower risk categories when receiving semaglutide versus placebo Both changes in UACR and eGFR contributed to improved KDIGO risk categories Participants in the semaglutide group were also more likely to achieve 20% reduction in UACR than the placebo group, regardless of their baseline KDIGO risk score CKD, chronic kidney disease; KDIGO, Kidney Disease Improving Global Outcomes; T2D, type 2 diabetes; UACR, urine albumin:creatinine ratio.


