Efficacy of Dolutegravir Plus Lamivudine vs Tenofovir/Emtricitabine in HIV Treatment
Study comparing the efficacy of Dolutegravir (DTG) plus Lamivudine (3TC) versus DTG plus Tenofovir/Emtricitabine (TDF/FTC) in treatment-naive adults with HIV-1 infection at week 48. The study discusses the non-inferior efficacy, safety, and tolerability of these regimens, highlighting the potential benefits of 2-drug regimens in minimizing drug exposure and long-term toxicity. GEMINI-1 and -2 phase III study design, inclusion criteria, primary endpoint, baseline stratification factors, and countries involved in the study are outlined.

Download Presentation

Please find below an Image/Link to download the presentation.
The content on the website is provided AS IS for your information and personal use only. It may not be sold, licensed, or shared on other websites without obtaining consent from the author. If you encounter any issues during the download, it is possible that the publisher has removed the file from their server.
You are allowed to download the files provided on this website for personal or commercial use, subject to the condition that they are used lawfully. All files are the property of their respective owners.
The content on the website is provided AS IS for your information and personal use only. It may not be sold, licensed, or shared on other websites without obtaining consent from the author.
E N D
Presentation Transcript
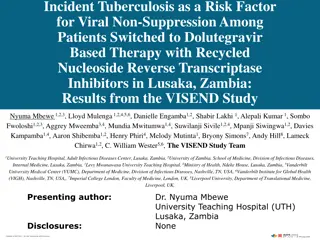
Non-Inferior Efficacy of Dolutegravir (DTG) Plus Lamivudine (3TC) vs DTG Plus Tenofovir/Emtricitabine (TDF/FTC) Fixed-Dose Combination in Antiretroviral Treatment Naive Adults With HIV-1 Infection Week 48 Results From the GEMINI Studies P. Cahn,1J. Sierra Madero,2J. Arribas,3A. Antinori,4R. Ortiz,5A. Clarke,6 C.-C. Hung,7J. Rockstroh,8P.-M. Girard,9C. Man,10J. Sievers,11A. Currie,12 M. Underwood,10A. Tenorio,10K. Pappa,10B. Wynne,10M. Gartland,10 M. Aboud,11K. Smith10 1Fundaci n Hu sped, Buenos Aires, Argentina; 2Instituto Nacional de Ciencias M dicas y Nutrici n Salvador Zubir n, Mexico City, Mexico; 3Hospital La Paz, Madrid, Spain; 4Istituto Nazionale per le Malattie Infettive Lazzaro Spallanzani, Rome, Italy; 5Bliss Healthcare Services, Orlando, FL, USA; 6Royal Sussex County Hospital, Brighton, UK; 7National Taiwan University Hospital, Taipei, Taiwan, Province of China; 8Rheinische Friedrich-Wilhelms Universit t, Bonn, Germany; 9H pital Saint Antoine, Paris, France; 10ViiV Healthcare, Research Triangle Park, NC, USA; 11ViiV Healthcare, Brentford, UK; 12GlaxoSmithKline, Stockley Park, UK 22nd International AIDS Conference; July 23-27, 2018; Amsterdam, the Netherlands
Introduction The requirement for lifelong ART for HIV infection has highlighted interest in 2DRs to minimize cumulative drug exposure1 Lower ARV exposure may translate to less long-term drug toxicity The potency, safety, and high resistance barrier of DTG make it an optimal core agent for 2-drug regimens (2DRs) The safety, tolerability, and efficacy of 3TC make it an attractive partner for initial HIV-1 treatment Previous pilot studies have evaluated DTG + 3TC as a complete 2DR in ART- naive participants PADDLE: 90% (18/20) had VL <50 c/mL at Week 482 ACTG A5353: 90% (108/120) had VL <50 c/mL at Week 243 We evaluated DTG + 3TC vs the 3-drug regimen (3DR) DTG + TDF/FTC for the treatment of patients with HIV-1 infection naive to ART through 48 weeks 1. Kelly et al. Drugs. 2016;76(5):523-531. 2. Cahn et al. J Int AIDS Soc. 2017;20(1):21678. 3. Taiwo et al. Clin Infect Dis. 2018;66(11):1689-1697. Cahn et al. AIDS 2018; Amsterdam, the Netherlands. Slides TUAB0106LB. 22nd International AIDS Conference; July 23-27, 2018; Amsterdam, the Netherlands
GEMINI-1 and -2 Phase III Study Design Identically designed, randomized, double-blind, parallel-group, multicenter, noninferiority studies Screening (28 d) Double-blind phase Open-label phase Continuation phase 1:1 DTG + 3TC DTG + 3TC (N=716) ART-naive adults VL 1000-500,000 c/mL DTG + TDF/FTC (N=717) Day 1 Week 24 Week 48 Week 96 Week 144 Countries Argentina Canada Italy Netherlands Portugal Romania Russian Federation South Africa Spain Taiwan United Kingdom United States Eligibility criteria 10 days of prior ART No evidence of pre-existing viral resistance based on presence of any major resistance- associated mutation No HBV infection or need for HCV therapy Primary endpoint at Week 48: participants with HIV-1 RNA <50 c/mL (ITT-E snapshot)a Australia France Republic of Korea Peru Belgium Germany Mexico Poland Switzerland Baseline stratification factors: plasma HIV-1 RNA ( 100,000 c/mL vs >100,000 c/mL) CD4+ cell count ( 200 cells/mm3 vs >200 cells/mm3). a 10% noninferiority margin for individual studies. Cahn et al. AIDS 2018; Amsterdam, the Netherlands. Slides TUAB0106LB. 22nd International AIDS Conference; July 23-27, 2018; Amsterdam, the Netherlands
Demographic and Baseline Characteristics for the Pooled GEMINI-1 and -2 Population DTG + 3TC (N=716) DTG + TDF/FTC (N=717) Characteristic 32.0 (18-72) 65 (9) 33.0 (18-70) 80 (11) Age, median (range), y 50 y, n (%) 113 (16) 98 (14) Female, n (%) Race, n (%) African American/African heritage Asian White Other Ethnicity, n (%) Hispanic or Latino Not Hispanic or Latino 99 (14) 71 (10) 480 (67) 66 (9) 76 (11) 72 (10) 497 (69) 72 (10) 215 (30) 501 (70) 232 (32) 485 (68) 4.43 (1.59-6.27) 576 (80) 140 (20) 4.46 (2.11-6.37) 564 (79) 153 (21) HIV-1 RNA, median (range), log10 c/mL 100,000 >100,000a 427.0 (19-1399) 653 (91) 63 (9) 438.0 (19-1497) 662 (92) 55 (8) CD4+ cell count, median (range), cells/mm3 >200 200 a2% of participants in each arm had baseline HIV-1 RNA >500,000 c/mL Cahn et al. AIDS 2018; Amsterdam, the Netherlands. Slides TUAB0106LB. 22nd International AIDS Conference; July 23-27, 2018; Amsterdam, the Netherlands
Snapshot Outcomes at Week 48 for GEMINI-1 Virologic outcome Adjusted treatment difference (95% CI)a DTG + 3TC (N=356) DTG + TDF/FTC (N=358) GEMINI-1 DTG + TDF/FTC DTG + TDF/FTC DTG + 3TC 100 93 GEMINI-1 90 -2.6 HIV-1 RNA <50 c/mL, % -6.7 1.5 80 60 40 -10 -8 -6 Percentage-point difference -4 -2 0 2 4 6 8 10 20 6 6 4 2 0 Virologic success Virologic nonresponse No virologic data aBased on Cochran-Mantel-Haenszel stratified analysis adjusting for the following baseline stratification factors: plasma HIV-1 RNA ( 100,000 c/mL vs >100,000 c/mL) and CD4+ cell count ( 200 cells/mm3 vs >200 cells/mm3). Cahn et al. AIDS 2018; Amsterdam, the Netherlands. Slides TUAB0106LB. 22nd International AIDS Conference; July 23-27, 2018; Amsterdam, the Netherlands
Snapshot Outcomes at Week 48 for GEMINI-1 and -2 Virologic outcome Adjusted treatment difference (95% CI)a DTG + 3TC (N=356) DTG + 3TC (N=360) DTG + TDF/FTC (N=358) DTG + TDF/FTC (N=359) GEMINI-1 GEMINI-2 DTG + TDF/FTC DTG + TDF/FTC DTG + 3TC 100 94 93 93 GEMINI-1 90 -2.6 HIV-1 RNA <50 c/mL, % -6.7 1.5 80 -0.7 GEMINI-2 60 -4.3 2.9 40 -10 -8 -6 Percentage-point difference DTG + 3TC is non-inferior to DTG + TDF/FTC with respect to proportion <50 c/mL at Week 48 (snapshot, ITT-E population) in both studies -4 -2 0 2 4 6 8 10 20 6 6 5 4 4 2 2 2 0 Virologic success Virologic nonresponse No virologic data aBased on Cochran-Mantel-Haenszel stratified analysis adjusting for the following baseline stratification factors: plasma HIV-1 RNA ( 100,000 c/mL vs >100,000 c/mL) and CD4+ cell count ( 200 cells/mm3 vs >200 cells/mm3). Cahn et al. AIDS 2018; Amsterdam, the Netherlands. Slides TUAB0106LB. 22nd International AIDS Conference; July 23-27, 2018; Amsterdam, the Netherlands
Snapshot Analysis by Visit: Pooled ITT-E Population 100 93 93 91 89 90 87 HIV-1 RNA <50 c/mL, % 91 93 72 88 80 90 8589 70 60 40 DTG + 3TC (n=716) DTG + TDF/FTC (n=717) 20 0 0 -20 -4 0 4 8 12 16 20 24 28 32 36 40 44 48 Study visit Cahn et al. AIDS 2018; Amsterdam, the Netherlands. Slides TUAB0106LB. 22nd International AIDS Conference; July 23-27, 2018; Amsterdam, the Netherlands
Snapshot Analysis by Visit: Pooled ITT-E Population 100 93 93 91 89 90 87 HIV-1 RNA <50 c/mL, % 91 93 72 88 80 90 8589 70 60 40 DTG + 3TC (n=716) DTG + TDF/FTC (n=717) 20 CD4+ cell count (cells/mm3) DTG + 3TC DTG + TDF/FTC 224 218 Adjusted mean change from baseline at Week 48a 0 0 -20 -4 0 4 8 12 16 20 24 28 32 36 40 44 48 Study visit aCalculated from a repeated measures model adjusting for study, treatment, visit (repeated factor), baseline plasma HIV-1 RNA, baseline CD4+ cell count, treatment and visit interaction, and baseline CD4+ cell count and visit interaction. Cahn et al. AIDS 2018; Amsterdam, the Netherlands. Slides TUAB0106LB. 22nd International AIDS Conference; July 23-27, 2018; Amsterdam, the Netherlands
Pooled Snapshot Outcomes at Week 48: ITT-E Population Virologic outcome Adjusted treatment difference (95% CI)a DTG + 3TC (N=716) DTG + TDF/FTC (N=717) ITT-E DTG + TDF/FTC DTG + 3TC 100 93 91 -1.7 ITT-E HIV-1 RNA <50 c/mL, % -4.4 1.1 80 60 40 -10 -8 -6 -4 -2 0 2 4 6 8 10 Percentage-point difference 20 6 5 3 2 0 Virologic success Virologic nonresponse No virologic data aBased on Cochran-Mantel-Haenszel stratified analysis adjusting for the following baseline stratification factors: plasma HIV-1 RNA ( 100,000 c/mL vs >100,000 c/mL), CD4+ cell count ( 200 cells/mm3 vs >200 cells/mm3), and study (GEMINI-1 vs GEMINI-2). Cahn et al. AIDS 2018; Amsterdam, the Netherlands. Slides TUAB0106LB. 22nd International AIDS Conference; July 23-27, 2018; Amsterdam, the Netherlands
Pooled Snapshot Outcomes at Week 48: ITT-E and Per Protocol Populations Virologic outcome Adjusted treatment difference (95% CI)a DTG + 3TC (N=716) DTG + 3TC (N=694) DTG + TDF/FTC (N=717) DTG + TDF/FTC (N=693) ITT-E PPb DTG + TDF/FTC DTG + 3TC 100 94 93 93 91 -1.7 ITT-E HIV-1 RNA <50 c/mL, % -4.4 1.1 80 -1.3 60 PP 1.2 -3.9 40 -10 -8 -6 -4 -2 0 2 4 6 8 10 Percentage-point difference DTG + 3TC is non-inferior to DTG + TDF/FTC with respect to proportion <50 c/mL at Week 48 (snapshot, ITT-E population) in both studies 20 6 5 5 4 3 2 2 1 0 Virologic success Virologic nonresponse No virologic data aBased on Cochran-Mantel-Haenszel stratified analysis adjusting for the following baseline stratification factors: plasma HIV-1 RNA ( 100,000 c/mL vs >100,000 c/mL), CD4+ cell count ( 200 cells/mm3 vs >200 cells/mm3), and study (GEMINI-1 vs GEMINI-2). bPP, per protocol: population consisted of participants in the ITT-E population except for significant protocol violators, which could potentially affect efficacy outcomes as determined by the medical monitor prior to database lock. Cahn et al. AIDS 2018; Amsterdam, the Netherlands. Slides TUAB0106LB. 22nd International AIDS Conference; July 23-27, 2018; Amsterdam, the Netherlands
Pooled Outcomes at Week 48 Stratified by Baseline HIV-1 RNA: Snapshot Analysis Snapshot Analysis 100 94 93 93 93 92 91 90 HIV-1 RNA <50 c/mL, % 79 80 60 40 20 526 576 531 564 129 140 138 153 605 653 618 662 50 67 51 55 0 100,000 Baseline HIV-1 RNA, c/mL >100,000 >200 Baseline CD4+ cell count, cell/mm3 200 DTG + 3TC DTG + TDF/FTC 2% of participants in each arm had baseline HIV-1 RNA >500,000 c/mL Cahn et al. AIDS 2018; Amsterdam, the Netherlands. Slides TUAB0106LB. 22nd International AIDS Conference; July 23-27, 2018; Amsterdam, the Netherlands
Pooled Outcomes at Week 48 Stratified by Baseline HIV-1 RNA and CD4+ Cell Count: Snapshot Analysis Snapshot Analysis 100 94 93 93 93 92 91 90 HIV-1 RNA <50 c/mL, % 79 80 60 40 20 526 576 531 564 129 140 138 153 605 653 618 662 50 63 51 55 0 100,000 Baseline HIV-1 RNA, c/mL >100,000 >200 Baseline CD4+ cell count, cell/mm3 200 DTG + 3TC DTG + TDF/FTC 2% of participants in each arm had baseline HIV-1 RNA >500,000 c/mL Cahn et al. AIDS 2018; Amsterdam, the Netherlands. Slides TUAB0106LB. 22nd International AIDS Conference; July 23-27, 2018; Amsterdam, the Netherlands
Pooled Outcomes at Week 48 Stratified by Baseline HIV-1 RNA and CD4+ Cell Count: Snapshot and TRDF Analysis Snapshot Analysis TRDF Analysis 100 99 98 98 98 98 98 97 100 94 100 93 93 93 92 91 90 HIV-1 RNA <50 c/mL, % 79 80 80 Without TRDF, % 60 60 40 40 20 20 526 576 531 564 129 140 138 153 605 653 618 662 50 63 51 55 566 576 553 564 138 140 149 153 642 653 647 662 62 63 55 55 0 0 100,000 Baseline HIV-1 RNA, c/mL >100,000 >200 Baseline CD4+ cell count, cell/mm3 200 100,000 Baseline HIV-1 RNA, c/mL >100,000 >200 Baseline CD4+ cell count, cell/mm3 200 DTG + 3TC DTG + TDF/FTC 2% of participants in each arm had baseline HIV-1 RNA >500,000 c/mL Treatment related discontinuation = failure (TRDF) population accounts for confirmed virologic withdrawal (CVW), withdrawal due to lack of efficacy, withdrawal due to treatment-related AE, and participants who met protocol-defined stopping criteria DTG + 3TC CD4 <200 Snapshot non-response (n=13): 1 CVW, 3 with VL >50 in window (2 of 3 re-suppressed), 2 discontinued due to AE (TB, Chagas disease), 2 protocol violations, 2 lost to follow-up, 1 withdrew consent, 1 withdrew to start HCV treatment, 1 change in ART (incarcerated) DTG + TDF/FTC < 200 Snapshot non-response (n=4):1 investigator discretion, 1 withdrew consent, 1 lost to follow-up, 1 VL >50 (re-suppressed) Cahn et al. AIDS 2018; Amsterdam, the Netherlands. Slides TUAB0106LB. 22nd International AIDS Conference; July 23-27, 2018; Amsterdam, the Netherlands
Confirmed Virologic Withdrawals Through Week 48: ITT-E Population Low rates of virologic withdrawals were observed at Week 48 GEMINI 1 GEMINI 2 Pooled DTG + TDF/FTC (N=358) 2 (<1) DTG + TDF/FTC (N=359) 2 (<1) DTG + TDF/FTC (N=717) 4 (<1) DTG + 3TC (N=356) 4 (1) DTG + 3TC (N=360) 2 (<1) DTG + 3TC (N=716) 6 (<1) Variable, n (%) CVW Treatment-emergent resistance 0 0 0 0 0 0 No treatment-emergent INSTI mutations or NRTI mutations were observed among participants who met CVW (confirmed virologic failure) criteria Confirmed virologic withdrawal criteria is defined as a second and consecutive HIV-1 RNA value meeting virologic non-response or rebound. Virologic non-response is defined as either a decrease in plasma HIV-1 RNA of less than 1 log10 c/mL by Week 12 with subsequent confirmation unless plasma HIV-1 RNA is <200 c/mL, or confirmed plasma HIV-1 RNA levels 200 c/mL on or after Week 24. Virologic rebound is defined as confirmed rebound in plasma HIV-1 RNA levels to 200 c/mL after prior confirmed suppression to <200 c/mL. . Cahn et al. AIDS 2018; Amsterdam, the Netherlands. Slides TUAB0106LB. 22nd International AIDS Conference; July 23-27, 2018; Amsterdam, the Netherlands
Adverse Events: Pooled ITT-E Population DTG + 3TC (N=716) 543 (76) DTG + TDF/FTC (N=717) 579 (81) n (%) Any AE AE occurring in 5% of participants in either group Headache Diarrhea Nasopharyngitis Upper respiratory tract infection Nausea Insomnia Pharyngitis Back pain Drug-related AE Grade 2-4 AE occurring in 1% of participants Headache AE leading to withdrawal from the study Neuropsychiatric AEs leading to withdrawal Any serious AEa 71 (10) 68 (9) 55 (8) 56 (8) 27 (4) 27 (4) 36 (5) 35 (5) 126 (18) 42 (6) 8 (1) 15 (2) 6 (<1) 50 (7) 75 (10) 77 (11) 78 (11) 44 (6) 53 (7) 45 (6) 32 (4) 31 (4) 169 (24) 47 (7) 8 (1) 16 (2) 4 (<1) 55 (8) a2 deaths (acute myocardial infarction, n=1; Burkitt s lymphoma, n=1) in the GEMINI-2 study; both were in the DTG + 3TC group and were considered unrelated to the study drug regimen. Cahn et al. AIDS 2018; Amsterdam, the Netherlands. Slides TUAB0106LB. 22nd International AIDS Conference; July 23-27, 2018; Amsterdam, the Netherlands
Adverse Events Leading to Withdrawal: Pooled ITT-E Population DTG + 3TC (N=716) 15 (2) DTG + TDF/FTC (N=717) 16 (2) n (%) Participants with AEs leading to withdrawal from the study All events leading to withdrawal (participant may report >1 AE) Hepatitis A Alcoholic hepatitis Acute hepatitis C Hepatoxicity Drug-induced liver injury Hepatitis C Renal impairment Creatinine renal clearance decreased Glomerular filtration rate decreased Anxiety Depression Suicide attempt Suicidal ideation Insomnia Sleep disorder Psychotic disorder Substance-induced psychotic disorder Overdose Alcoholic psychosis Acute myocardial infarction Burkitt s lymphoma Non-Hodgkin s lymphoma B-cell lymphoma Pulmonary tuberculosis Tuberculous pleurisy Osteoporosis Rhabdomyolysis 2 (<1) 1 (<1) 1 (<1) 1 (<1) 0 0 1 (<1) 0 0 1 (<1) 1 (<1) 1 (<1) 1 (<1) 1 (<1) 1 (<1) 1 (<1) 1 (<1) 0 0 1 (<1) 1 (<1) 0 0 1 (<1) 1 (<1) 0 0 1 (<1) 1 (<1) 1 (<1) 0 1 (<1) 1 (<1) 2 (<1) 1 (<1) 1 (<1) 1 (<1) 1 (<1) 1 (<1) 1 (<1) 0 0 0 0 1 (<1) 1 (<1) 0 0 1 (<1) 1 (<1) 0 0 1 (<1) 1 (<1) Cahn et al. AIDS 2018; Amsterdam, the Netherlands. Slides TUAB0106LB. 22nd International AIDS Conference; July 23-27, 2018; Amsterdam, the Netherlands
Change in Renal Biomarkers at Week 48: Pooled ITT-E Population Plasma/Serum markers Urine markers *p<0.001a * * 40 13.5 15 Adjusted mean change from baselinea 10.4 * 31.2 10 Change from baseline, %b 30 6.3 4.1 5 * 20 * 0 11.4 * 10 -5 2.9 0 -10 -12.1 -10 -7.4 -7.7 -15 -15.5 -13.1 -20 -20 GFR from cystatin C, CKD-EPI (mL/min/ 1.73 m2) Creatinine ( mol/L) GFR from creatinine, CKD-EPI (mL/min/1.73 m2) Protein/ Creatinine (g/mol) Retinol-binding protein/ Creatinine ( g/mmol) Beta-2 microglobulin/ Creatinine (mg/mmol) DTG + 3TC (n=716) DTG + TDF/FTC (n=717) aEstimated mean change from baseline at Week 48 in each arm calculated from ANCOVA model adjusting for: study, treatment, baseline plasma HIV-1 RNA, baseline CD4+ cell count, age, sex, race, presence of diabetes mellitus, presence of hypertension, and baseline biomarker value. Multiple imputed dataset (missing at random). bEstimated from geometric mean ratio for baseline and Week 48. Cahn et al. AIDS 2018; Amsterdam, the Netherlands. Slides TUAB0106LB. 22nd International AIDS Conference; July 23-27, 2018; Amsterdam, the Netherlands
Change in Bone Markers at Week 48: Pooled ITT-E Population *p<0.001 * 15 DTG + 3TC (n=716) DTG + TDF/FTC (n=717) Adjusted mean change from 13.10 baseline ( g/L)a 10 * 6.17 * 5 4.07 * 1.22 0.60 0.40 0.33 0.14 0 Serum bone specific alkaline phosphatase Serum osteocalcin Serum procollagen 1 N-terminal propeptide Serum type 1 collagen C-telopeptide aEstimated mean change from baseline at Week 48 in each arm calculated from ANCOVA model adjusting for study, treatment, baseline plasma HIV-1 RNA, baseline CD4+ cell count, age, sex, race, BMI, smoking status, current vitamin D use, and baseline biomarker value. Multiple imputed dataset (missing at random). Cahn et al. AIDS 2018; Amsterdam, the Netherlands. Slides TUAB0106LB. 22nd International AIDS Conference; July 23-27, 2018; Amsterdam, the Netherlands
Conclusions GEMINI-1 and-2 results demonstrate noninferior virologic efficacy for the 2DR DTG + 3TC vs the 3DR DTG + TDF/FTC at Week 48 Both DTG + 3TC and DTG + TDF/FTC were associated with low rates of confirmed virologic withdrawals through Week 48 No treatment-emergent INSTI or NRTI mutations were observed among participants who met CVW criteria Overall safety and tolerability profile at Week 48 was comparable between the 2 regimens Fewer drug-related AEs with DTG + 3TC Change in renal and bone biomarkers significantly favors DTG + 3TC These data support DTG + 3TC as an effective option for the treatment of HIV-1 infection Cahn et al. AIDS 2018; Amsterdam, the Netherlands. Slides TUAB0106LB. 22nd International AIDS Conference; July 23-27, 2018; Amsterdam, the Netherlands
Acknowledgements We thank everyone who has contributed to the success of these studies, including ViiV/GSK clinical study teams The GEMINI-1 and GEMINI-2 clinical investigators and their staff Argentina Cassetti David Figueras Figueroa Losso Lopardo Lupo Porteiro S nchez Canada Angel Baril Conway De Pokomandy Szabo Walmsley Italy Antinori Barchi Caramello Castelli Cattelan D Arminio Di Biargo Di Perri Gori Maggiolo Mussini Penco Puoti Rizzardini Gulminetti Lazzarin Quirino Sighinolfi Viale Netherlands Den Hollander Rijnders Russia Belonosova Borodkina Chernova Gankina Kizhlo Kulagin Kurina Nagimova Pokrovsky Riamova Voronin Yakovlev Spain Antela Lopez Arribas Lopez Casado Osorio Casta o Carracedo De Los Santos Gil Estrada perez Falco Force Galinda Puerto Garcia Deltoro Gatell Goenaga Sanchez Knobel Lopez Bernaldo de Quiros Losa Garcia Masia Montero-Alsonso Ocampo Hermida Pasquau Portilla Sogorb Pulido Rivera Roman Santos Fernandez Torres Perea Troya Viciana Switzerland Calmy Hauser Fehr USA (cont) Crofoot Cunningham DeJesus Dretler Eron Fife Fichtenbaum Flamm Goldstein Hagins Hoffman-Terry Jayaweera Kinder Klein McDonald Mills Nahass Ortiz Osiyemi Overton Parks Prelutsky Ramgopal Schrader USA (cont) Simon Sims Skiest Slim Tashima Thedinger Peru Hidalgo Hercilla Illescas Taiwan Cheng Ko Lin Lu Hung Tseng Wang Wong Yang France Bouchaud Chidiac Delobel Girard Goujard Katlama Molina Pialoux Philibert United Kingdom Clarke Gazzard Fox Johnson Kegg Khoo Mazhude Orkin Schembri Ustianowski Poland Olczak Australia Bloch Cooper Finlayson Koh Lewis McMahon Moore Roth Portugal Mansinho Pacheco Te filo Saraiva da Cunha Sarmento e Castro Serr o South Africa Kaplan USA Arduino Benson Berhe Bredeek Benson Brinson Campbell Crofoot Cunningham DeJesus Dretler South Korea Lee Kim Kim Kim Germany Bogner Esser Krznaric Lehmann Rockstroh Spinner Stellbrink Stephan Stoehr Romania Arbune Jianu Preotescu Prisacariu Belgium De Wit Florence Goffard Demeester Lacor Vandercam Vandekerckh ove Mexico Amaya Tapia Andrade Villanueva Granados Reyes Sierra-Madero Perez Rios Santoscoy Gomez Special recognition to the people living with HIV who have generously participated in the GEMINI trials 22nd International AIDS Conference; July 23-27, 2018; Amsterdam, the Netherlands
BACKUP SLIDES 22nd International AIDS Conference; July 23-27, 2018; Amsterdam, the Netherlands
Change in Serum Lipids at Week 48: Pooled ITT-E Population *p<0.05 ** **p<0.001 5 * Adjusted mean change from baselinea 0.32 DTG + 3TC (n=716) DTG + TDF/FTC (n=717) 0.15 0.24 0.12 4 ** 3 0.17 0.14 * 2 ** 0.03 0.08 0.15 0.02 1 0 Total HDL LDL Triglycerides (mmol/L) Total cholesterol/ HDL cholesterol ratio cholesterol (mmol/L) cholesterol (mmol/L) cholesterol (mmol/L) aThe adjusted mean is the estimated mean change from baseline in each fasting lipid at Week 48 in each arm calculated from an ANCOVA model adjusting for the following covariates/factors: study treatment, baseline plasma HIV-1 RNA, baseline CD4+ cell count, age and fasting lipids at baseline. Multiple imputed dataset (missing at random). Absolute values based on summaries. Baseline values are represented by the main legend colors, with changes at Week 48 represented by shaded areas (increases) or dashed lines (decreases). Cahn et al. AIDS 2018; Amsterdam, the Netherlands. Slides TUAB0106LB. 22nd International AIDS Conference; July 23-27, 2018; Amsterdam, the Netherlands
 Plus")