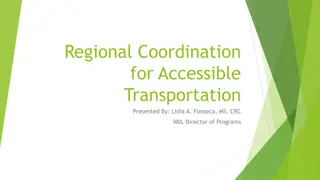
Efficiency Improvement Strategies in Transportation and Human Capital Management
Explore the efficiency improvement strategies outlined in the findings of the task force, focusing on transportation efficiency and human capital efficiency. Delve into the cost analysis of regional busing transportation and proposed revenue-generating initiatives. Additionally, summarize Mike's concerns and recommendations for optimizing regional bus services.

Download Presentation

Please find below an Image/Link to download the presentation.
The content on the website is provided AS IS for your information and personal use only. It may not be sold, licensed, or shared on other websites without obtaining consent from the author. If you encounter any issues during the download, it is possible that the publisher has removed the file from their server.
You are allowed to download the files provided on this website for personal or commercial use, subject to the condition that they are used lawfully. All files are the property of their respective owners.
The content on the website is provided AS IS for your information and personal use only. It may not be sold, licensed, or shared on other websites without obtaining consent from the author.
E N D
Presentation Transcript
Findings of the Task Force Findings of the Task Force center on the following areas: center on the following areas: Transportation Efficiency Transportation Efficiency Human Capital Efficiency Human Capital Efficiency 3
Regional Busing Transportation Cost Analysis Regional Busing Transportation Cost Analysis The additional costs to district: The additional costs to district: (excluding non (excluding non- -drivers except the addition of one clerk) drivers except the addition of one clerk) Cost Cost $1,612,016 FEFP received from state: FEFP received from state: (1322 students) (1322 students) $580,609 Net additional costs to district: Net additional costs to district: (additional costs less FEFP) (additional costs less FEFP) $1,031,407 FEFP received from State FEFP received from State is approximately one is approximately one- -third of the District Cost. of the District Cost. Net annual cost to district for each regional bus student: Net annual cost to district for each regional bus student: (1322 students) (1322 students) $780.19 third Daily cost per student (1322 students) (1322 students) $4.33 5
Summarize Mikes Summarize Mike s Concerns here Concerns here 12
For efficiency, reduce Regional Bus stops by half next school year Institute a Regional Bus fee: $455.00 per rider per semester ($5/day plus $5 registration fee) Potential annual revenue: $90,000 per 100 paid riders minus the lost FEFP if fewer riders Annual gross revenue for 440 riders = $396,000 Lost FEFP for 1322 - 440 riders = $387,366 Net revenue for 440 riders = $8,634 School Wheels Direct transported 440 students SY 2013-14 $6.25 per day Annual gross revenue for 880 riders = $792,000 Lost FEFP for 1322 - 880 riders = $194,122 Net revenue for 880 riders = $597,878 13
Human Capital Human Capital Division of Equity, Innovation and Choice (EIC) Staff Demands: Utilize Open Enrollment application vendor, Scribbles Software Development of the application and payment process Educational Program Opportunity (EPO) seat acceptance activates Regional Bus application Development of Terms and Conditions District Operations, Division of Transportation Staff Demands: Monitoring applications, payments received and bus assignments Reconciliation of Regional Bus payments to ridership Customer service related to Regional Busing Enforcement of the Terms and Conditions 14