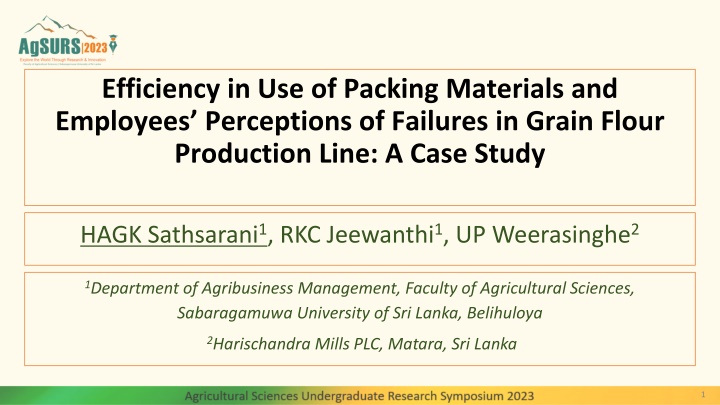
Efficiency in Grain Flour Production Line: A Case Study on Packing Materials Use
This case study delves into factors affecting failures in grain flour production and proposes process improvement methods. It explores the efficiency of packing materials use and employee perceptions of failures in a real-world scenario.

Download Presentation

Please find below an Image/Link to download the presentation.
The content on the website is provided AS IS for your information and personal use only. It may not be sold, licensed, or shared on other websites without obtaining consent from the author.If you encounter any issues during the download, it is possible that the publisher has removed the file from their server.
You are allowed to download the files provided on this website for personal or commercial use, subject to the condition that they are used lawfully. All files are the property of their respective owners.
The content on the website is provided AS IS for your information and personal use only. It may not be sold, licensed, or shared on other websites without obtaining consent from the author.
E N D
Presentation Transcript
Efficiency in Use of Packing Materials and Employees Perceptions of Failures in Grain Flour Production Line: A Case Study HAGK Sathsarani1, RKC Jeewanthi1, UP Weerasinghe2 1Department of Agribusiness Management, Faculty of Agricultural Sciences, Sabaragamuwa University of Sri Lanka, Belihuloya 2Harischandra Mills PLC, Matara, Sri Lanka 1
Content Content Introduction Research Objectives Conceptualization Framework Material and Methods Results and Discussion Conclusion and Recommendations References 2
Introduction Introduction The Companies with grain mills have critical problems related to efficiency of production process due to the failures and defects. Harischandra company is one of leading flour based product manufacturing company. There are different types of grinding mills products. 1. Ulundu flour 5.Hopper mixture 2. Thosai mixture 6.Rice flour 3. Kurakkan thosai mixture 7.Red rice string hopper flour 4. Kurakkan flour 8.White rice string hopper flour Failure Mode and Effect Analysis (FMEA) technique helps for management of the production line to identify production failures. PDCA cycle shows a great use in solving problems(Yu, 2017). PDCA cycle methodology causes to continuous improvement. 3
Objectives Objectives Broad Objective To study on factors affecting to failures (based on workers perception), analyzing the failures/ defects and establishing process improvement methods in grain flour products processing line. Specific Objectives 1. To identify the basic factors, affect to failures/defects in grain flour based product processing line (based on workers perception). 2. To evaluate the packing materials wastage percentage of each product in grinding mill section(From total weight of packing materials wastage). 3. To analyze failures/ defects and identify the solutions to reduce the effect of those failures/ defects in grain flour based product processing line. 4. To apply PDCA cycle technique to overcome the high waste percentages of the packing materials in the grinding mill section. 4
Conceptualization Framework Conceptualization Framework Figure 1- Conceptualization framework of the study 5
Material and Methods Material and Methods Research Location =Grinding mill production line in Harischandra Mills PLC, Matara . Operators 07 Grinding mill section Harischandra Mills PLC Other labours (Packing, bundling, filling) 43 50 Figure 2- Sample of the study 6
Material and Material and Methods Methods cont cont Research Design Research strategy - Survey method, FMEA Data collection method Primary data Questionnaire, Interviews secondary data -journal articles, web sites, company records and annual reports of the company Data analysis techniques Quantitative analysis techniques(. SPSS 22 version, MS Excel 2013 version, FMEA technique) 7
Results and Discussion Results and Discussion Table 1- Reliability Statistics Geory and Malley (2003) introduced following rule of thumb. 0.9 -Excellent 0.8 -Good 0.7 -Acceptable 0.6 -Questionable 0.5 -Poor 0.5 - Unacceptable 8
Results and Results and Discussion cont.. Discussion cont.. Objective 01- To identify the basic factors, affect to failures/ defects in Grain flour based product processing line (based on employees perception). Table 3-ANOVAa Table 2-Model Summaryb Sum of Mean Adjusted R Std. Error of Squares df Square Model F Sig. R Square Square the Estimate Durbin-Watson Model R 1 Regression 92.576 9 10.286 .000b 10.994 1 Residual .844a .712 .647 .967 1.450 37.424 40 .936 Total 130.000 49 a. Predictors: (Constant), Education background, Resources, Health a. Dependent Variable: Complaints issues, Lack of training, Technical issues, Forgeting , Working stress, b. Predictors: (Constant), Education background, Resources, Health Lack of experience, Lack of supervision issues, Lack of training, Technical issues, Forgeting , Working stress, Lack of experience, Lack of supervision b. Dependent Variable: Complaints 9
Results and Discussion Results and Discussion Table 4-Coefficientstable Y=4.775 1.131X1 + 0.857X2+ 0.658X3- 1.453X4 Standardized Unstandardized Coefficients Coefficients X1=Resources Model B Std. Error Beta t Sig. 1 (Constant) 4.775 1.670 2.859 .007 X2= Working stress Technical issues .453 .255 .215 1.776 .083 Resources -1.131 .379 -.308 -2.983 .005 X3= Lack of experience Lack of supervision .206 .298 .093 .693 .492 Working stress .857 .344 .276 2.489 .017 X4= Education background Lack of experience .658 .193 .393 3.402 .002 Health issues -.247 .245 -.110 -1.007 .320 Forgetting -.111 .221 -.051 -.504 .617 Lack of training -.347 .217 -.178 -1.602 .117 Education background -1.453 .425 -.449 -3.416 .001 a. Dependent Variable: Complaints 10
Results and Discussion Results and Discussion Objective 2- To evaluate the packing materials wastage percentages of each product in grinding mill section(From total weight of packing materials wastage). Waste percentages of each product packaging materials from total weight of the packaging waste 28.52% 28.42% 30 25 20 11.99% 11.28% 11.08% 8.71% 15 10 5 0 KURAKKAN FLOUR WHITE RICE FLOUR KURAKKAN THOSAI MIXTURE HOPPER MIXTURE ULUNDU FLOUR THOSAI MIXTURE Figure 3- Packing materials wastage percentages of each product 11
Results and Discussion Results and Discussion Objective 03- To analyze failures and identify the solutions to reduce the effect of those failures in grain flour based product processing line. Failure mode and effect analysis (FMEA) technique helps for management of the production line to identify production failures. Firstly list of failures were noted in the each steps of the processing line. Then impact of the every failure was measured. Rating scales were used to measure severity, occurrence and detections of the failures. The RPN results were taken from multiplying the three ranking values of severity, occurrence and detection. FMEA can use for product or process. For that, a special team was formed. That team included 3 supervisors and 3 operators of the grinding mill section. 12
Results and Discussion Results and Discussion RPN Based on the FMEA results, it is known that 180 RPN value 160 140 majority of the production failures of the grain 120 100 flour based product are due to (Critical RPN 80 60 40 value =107) 20 0 1. Incorrect labelling 2. Poor sealing 3. Incorrect gas filling inside the package Failures 4. Quality failures of raw materials Figure 4- Graph on RPN values 13
Results and Discussion Results and Discussion Objective 04-To apply PDCA cycle technique to overcome the high wastage percentages of the packaging materials in the grinding mill section. In two months after adopting PDCA cycle Kurakkan flour production line was shown 13.4% of reduction in packaging wastage percentage. Ulundu flour production was shown 10.91 % of reduction. To solve the problem with high packaging materials wastage in the grinding mill section, PDCA cycle was used. Through adopting to PDCA cycle, grinding mill section had achieved good position by minimizing wastage percentages of packaging materials. Figure 5- Reducing wastage percentage through PDCA cycle 14
Results and Discussion Results and Discussion According to Ishikawa diagram mainly man/workers, materials and machines like root causes were impacted for this packaging wastage of the grinding mill section. Figure 6- Ishikawa diagram for identification of root causes 15
Conclusion and Recommendations Conclusion and Recommendations Resources, education background, lack of experience and working stress have an impact on the complaints on the failures/defects of the products . Kurakkan flour production was shown high packing materials wastage percentage (28.52% ). As the results of the FMEA analysis in grain flour product processing line, Incorrect labelling, poor sealing, incorrect gas filling inside the packets and quality failures of raw materials were shown high RPN values. Kurakkan flour packing materials waste percentage was decreased by 13.4% and Ulundu flour packing materials waste percentage was decreased by 11% in the grinding mill section using PDCA cycle. There are workers, machines and raw materials. Supervisors should check whether to employees, machines and raw materials follow the recommended guidelines. As well as a researcher recommends the PDCA cycle to overcome the failures/defects in the production line. 16
References References Arabian, H. H., Oraee, H., & Tavner, P. J. (2010). Failure Mode and Effect Analysis (FMEA) for wind turbine. International Journal of Electrical Power and Energy Systems, 32(7), 817- 824. Ates, A., Garengo, P., Cocca, P., & Bititci, U. (2013). The Development of SME Managerial Practice for EffectivePerformance Management. Journal of Small Business and Enterprise Development, 20(1), 28 54. Burlikowska, M. D. (2011) Application of FMEA method in enterprise focused on quality.Journal of Achievements in Materials and Manufacturing Engineering, 45(1), 89-102. Casea, K., Norb, A., & Teohc, P. C. (2010). A diagnostic service tool using FMEA.International Journal of Computer Integrated Manufacturing, 23(7), 640 654. Cole, R. E. (2002). From continuous improvement to continuous innovation. Total Quality Management & Business Excellence, 13(8), 1051-1056. Enkel, E., Bell J. & Hogenkamp H., (2011), Open Innovation Maturity Framework. International Journal of Innovation Management, 15(6), 1161 1189. European Commission. (2003). The New SME Definition: User Guide and Model Declaration. Official Journal of the European Union, 124, 36. 17
THANK YOU! 18