Efficient Data Visualization with JMP Dashboards
Discover how JMP dashboards can simplify complex data visualization, engage your audience, and save time in app development. Learn tips on creating interactive visuals for effective communication.

Download Presentation

Please find below an Image/Link to download the presentation.
The content on the website is provided AS IS for your information and personal use only. It may not be sold, licensed, or shared on other websites without obtaining consent from the author. If you encounter any issues during the download, it is possible that the publisher has removed the file from their server.
You are allowed to download the files provided on this website for personal or commercial use, subject to the condition that they are used lawfully. All files are the property of their respective owners.
The content on the website is provided AS IS for your information and personal use only. It may not be sold, licensed, or shared on other websites without obtaining consent from the author.
E N D
Presentation Transcript
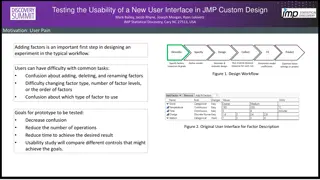
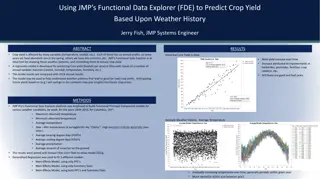
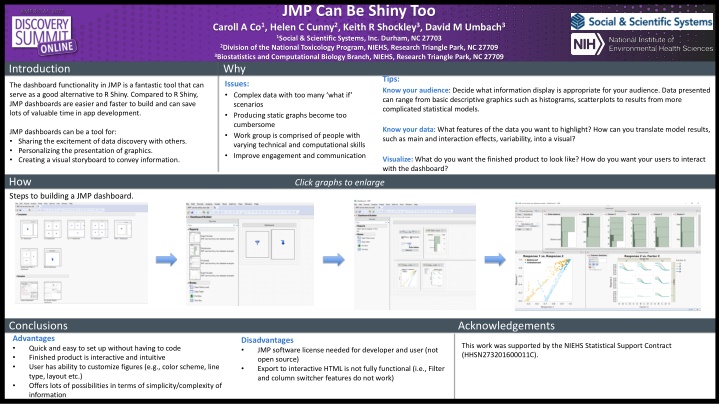
JMP Can Be Shiny Too Caroll A Co1, Helen C Cunny2, Keith R Shockley3, David M Umbach3 1Social & Scientific Systems, Inc. Durham, NC 27703 2Division of the National Toxicology Program, NIEHS, Research Triangle Park, NC 27709 3Biostatistics and Computational Biology Branch, NIEHS, Research Triangle Park, NC 27709 Why Issues: Complex data with too many what if scenarios Producing static graphs become too cumbersome Work group is comprised of people with varying technical and computational skills Improve engagement and communication Introduction Tips: Know your audience: Decide what information display is appropriate for your audience. Data presented can range from basic descriptive graphics such as histograms, scatterplots to results from more complicated statistical models. The dashboard functionality in JMP is a fantastic tool that can serve as a good alternative to R Shiny. Compared to R Shiny, JMP dashboards are easier and faster to build and can save lots of valuable time in app development. Know your data: What features of the data you want to highlight? How can you translate model results, such as main and interaction effects, variability, into a visual? JMP dashboards can be a tool for: Sharing the excitement of data discovery with others. Personalizing the presentation of graphics. Creating a visual storyboard to convey information. Visualize: What do you want the finished product to look like? How do you want your users to interact with the dashboard? How Steps to building a JMP dashboard. Click graphs to enlarge Screen Clipping Screen Clipping Screen Clipping Screen Clipping Conclusions Advantages Quick and easy to set up without having to code Finished product is interactive and intuitive User has ability to customize figures (e.g., color scheme, line type, layout etc.) Offers lots of possibilities in terms of simplicity/complexity of information Acknowledgements Disadvantages JMP software license needed for developer and user (not open source) Export to interactive HTML is not fully functional (i.e., Filter and column switcher features do not work) This work was supported by the NIEHS Statistical Support Contract (HHSN273201600011C).
Thumbnails of open reports show up here Drag & drop thumbnails of reports to dashboard
Edit Dashboard Save script Dynamic Linking Observations selected in this region are automatically highlighted in other panels.