Efficient Sampling Methods in Statistics
Explore various sampling methods in statistics like simple random sampling, systematic sampling, probability vs. non-probability sampling, and techniques to determine sample size using Cochran's and Yamani's formulas. Learn how to implement sampling in R for data analysis.

Download Presentation

Please find below an Image/Link to download the presentation.
The content on the website is provided AS IS for your information and personal use only. It may not be sold, licensed, or shared on other websites without obtaining consent from the author. If you encounter any issues during the download, it is possible that the publisher has removed the file from their server.
You are allowed to download the files provided on this website for personal or commercial use, subject to the condition that they are used lawfully. All files are the property of their respective owners.
The content on the website is provided AS IS for your information and personal use only. It may not be sold, licensed, or shared on other websites without obtaining consent from the author.
E N D
Presentation Transcript
Statistics Descriptive ristu.Saptono@staff.uns.ac.id
Outline Sample Review Statistics Descriptive
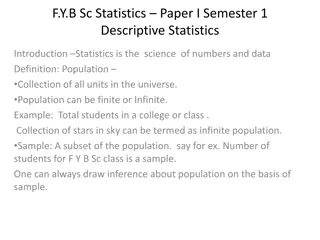
Sample Probability Non-probability
Sampling Methods Probability sample Simple Random Sampling Systematics Sampling Stratified Sampling Cluster or Multistage random sampling Non-probability sample Convenience Sampling Quota Sampling Purposive Sampling
Sample Size Square root plus one Cochran Formula Yamani Formula
Square root plus one If we a population with size ? then we can make a sampling with the size of the sample ? ? = Example: We have 1040 data of football clubs in the current session. Furthermore, we can draw a sample with the size as follows ? + 1 ? = 1040 + 1 33
Cochrans Rule Cochran uses the probability of even ? and the margin of error ?, and formulates a rule to determine the size of sample as follow ? =?2?(1 ?) ?2 Where: ? is Gaussian probability under the normal curve (1.96) ? is a known probability of an even (0.5) ? is a certain margin of error (the desired precision level
Cochrans formula adjustment Cochran s formula for a known size of population ? with ?1= ?0 1 +?0 1 ?
Yamanis Formula This formula is ? ? = 1 + ?(?2) where ? and ? are the size of population and the margin of error respectively Example: From previous example we have a population with 1040, if we want a sample with 0.05 margin of error then 1040 1 + 1040 0.052 289 ? =
How to get sample in R > data<-iris > dim(data) > head(data) > smp<-sample(seq(1,dim(data)[1]),5) >data[sort(smp),]
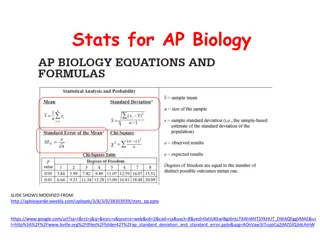
Key points Descriptive statistics summarizes or describes the characteristics of a data set, which can be either a whole population or a sample. Descriptive statistics consists of three basic categories of measures: measures of central tendency, measures of variability (or spread), and frequency distribution.
Central Tendency Measures of central tendency describe the center of the data set (mean, median, mode)
Mean Definition The average value in a collection of numbers How: We can get mean of a dataset ? from the average of the element on a variable ? ? = ??? ? Where ??is element of ? and ? is the size of the dataset.
Median Definition A value or a quantity lying at the midpoint of a frequency distribution of observed values How: We can get the midpoint value by identifying the middle index of increasing sort of observed values.
Mode Definition The number that occurs most often How We can get the mode of observing values by counting the frequency of distinct values and taking the biggest one.
Variability Measures of variability describe the dispersion of the data set (variance, standard deviation).
Variance Definition A measurement of the spread between numbers in a dataset, or how far each number in the set is from the mean (average). How ?2= ??? ? ?
Standard Deviation Definition Square root of variance How ??? ? ? ?? =
Frequency Distribution Measures of frequency distribution describe the occurrence of data within the data set (count). It will discuss for next chapter