Efficient Simulation Analysis Techniques for Computer Systems Performance
Explore key techniques for analyzing simulation results, including model verification, top-down modular design, antibugging methods, structured walk-through, and more, to ensure accurate and reliable computer systems performance analysis.

Download Presentation

Please find below an Image/Link to download the presentation.
The content on the website is provided AS IS for your information and personal use only. It may not be sold, licensed, or shared on other websites without obtaining consent from the author. If you encounter any issues during the download, it is possible that the publisher has removed the file from their server.
You are allowed to download the files provided on this website for personal or commercial use, subject to the condition that they are used lawfully. All files are the property of their respective owners.
The content on the website is provided AS IS for your information and personal use only. It may not be sold, licensed, or shared on other websites without obtaining consent from the author.
E N D
Presentation Transcript
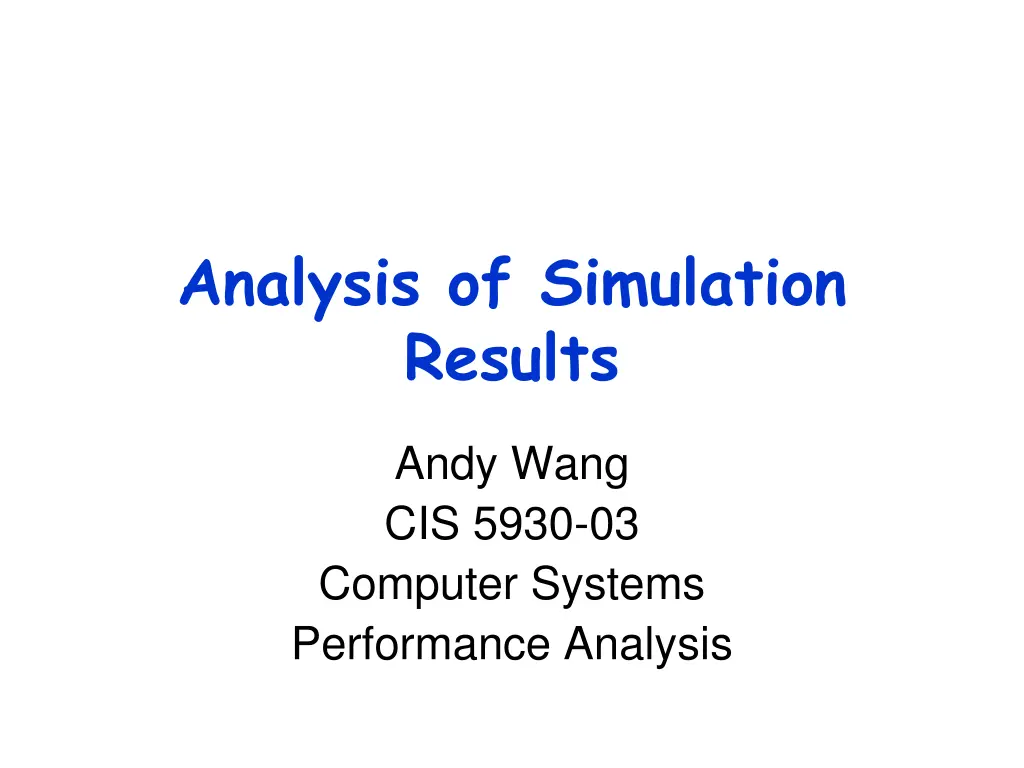
Analysis of Simulation Results Andy Wang CIS 5930-03 Computer Systems Performance Analysis
Analysis of Simulation Results Check for correctness of implementation Model verification Check for representativeness of assumptions Model validation Handle initial observations Decide how long to run the simulation 2
Model Verification Techniques Verification is similar to debugging Programmer s responsibility Validation Modeling person s responsibility 3
Top-Down Modular Design Simulation models are large computer programs Software engineering techniques apply Modularity Well-defined interfaces for pieces to coordinate Top-down design Hierarchical structure 4
Antibugging Sanity checks Probabilities of events should add up to 1 No simulated entities should disappear Packets sent = packets received + packets lost 5
Structured Walk-Through Explaining the code to another person Many bugs are discovered by reading the code carefully 6
Deterministic Models Hard to verify simulation against random inputs Should debug by specifying constant or deterministic distributions 7
Run Simplified Cases Use only one packet, one source, one intermediary node Can compare analyzed and simulated results 8
Trace Time-ordered list of events With associated variables Should have levels of details In terms of occurred events, procedure called, or variable updates Properly indented to show levels Should allow the traces to be turned on and off 9
On-line Graphic Displays Important when viewing a large amount of data Verifying a CPU scheduler preempt processes according to priorities and time budgets 10
Continuity Test Run the simulation with slightly different values of input parameters change in input should lead to change in output If not, possibly bugs 11
Degeneracy Test Test for extreme simulation input and configuration parameters Routers with zero service time Idle and peak load Also unusual combinations Single CPU without disk 12
Consistency Tests Check results for input parameters with similar effects Two sources with arrival rate of 100 packets per second Four sources with arrival rate of 50 packets per second If dissimilar, possibly bugs 13
Seed Independence Different random seeds should yield statistically similar results 14
Model Validation Techniques Should validate Assumptions Input values and distributions Output values and conclusions Against Expert intuition Real system measurements Theoretical results 15
Model Validation Techniques May not be possible to check all nine possibilities Real system not available May not be possible at all The reason why the simulation was built As the last resort E.g., economic model 16
Expert Intuition Should validate assumptions, input, and output separately and as early as possible Why would increased packet loss lead to better throughput? Throughput % packet loss 17
Real-System Measurements Most reliable way for validation Often not feasible System may not exist Too expensive to measure Apply statistical techniques to compare model and measured data Use multiple traces under different environments 18
Theoretical Results Can apply queueing models If too complex Can validate only the common scenarios Can validate a small subset of simulation parameters E.g., compare analytical equations with CPU simulation models with one and two cores Use validated simulation to simulate many cores 19
Transient Removal Transient Removal In most cases, we care only about steady-state performance We need to perform transient removal to remove initial data from analysis Difficulty Find out where transient state ends 20
Long Runs Just run the simulation for a long time Waste resources Not sure if it s long enough 21
Proper Initialization Start the simulation in a state close to steady state Pre-populate requests in various queues Pre-load memory cache content Pre-fragment storage (e.g., flash) Reduce the length of transient periods 22
Truncation Assume steady state variance < transient state variance Algorithm Measure variability in terms of range Remove the first L observations, one at a time Until the (L + 1)th observation is neither min nor max or the remaining observations 23
Truncation L 12 10 8 6 value 4 2 0 0 10 20 30 observation number 24
Initial Data Deletion m replications n data points for each replication Xij = jth data point in ith replication 12 10 8 6 xij 4 2 0 0 5 10 15 j 25
Initial Data Deletion Step 1: average across replications 10 8 6 mean xj 4 2 0 0 5 10 15 j 26
Initial Data Deletion Step 2: compute grand mean Step 3: compute L = average last n L values, L 10 8 mean of j = L to n 6 4 2 0 0 5 starting L 10 15 27
Initial Data Deletion Step 4: offset L by and normalize the result to by computing relative change L = ( L - )/ Transient interval 0.4 0.3 relative change L 0.2 0.1 0 0 5 starting L 10 15 28
Moving Average of Independent Replications Similar to initial data deletion Requires computing the mean over a sliding time window 29
Moving Average of Independent Replications m replications n data points for each replication Xij = jth data point in ith replication 12 10 8 6 xij 4 2 0 0 5 10 15 j 30
Moving Average of Independent Replications Step 1: average across replications 10 8 6 mean xj 4 2 0 0 5 10 15 j 31
Moving Average of Independent Replications Step 2: pick a k, say 1; average (j k)th data point to (j + k)th data point, j; increase k as necessary Transient interval 10 Moving averag e for j - 1, j, j + 1 8 6 4 2 0 0 5 10 15 j 32
Batch Means Used for very long simulations Divide N data points into m batches of n data points each Step 1: pick n, say 1; compute the mean for each batch Step 2: compute the mean of means Step 3: compute the variance of means Step 4: n++, go to Step 1 33
Batch Means Rationale: as n approaches the transient size, the variance peaks Does not work well with few data points Transient interval 12 10 8 variance of batch means 6 4 2 0 0 5 10 batch size n 34
Terminating Simulations Terminating simulations: for systems that never reach a steady state Network traffic consists of the transfer of small files Transferring large files to reach steady state is not useful System behavior changes with time Cyclic behavior Less need for transient removal 35
Terminating Conditions Increase the number of multimedia streams Until missing 10 deadlines within a time window May not terminate One deadline miss may stretch across time windows Fix: until missing 3 deadlines 36
Final Conditions Handling the end of simulations Might need to exclude some final data points E.g., Mean service time = total service time/n completed jobs 37
Stopping Criteria: Variance Estimation If the simulation run is too short Results highly variable If too long Wasting resources Only need to run until the confidence interval is narrow enough Since confidence interval is a function of variance, how do we estimate variance? 38
Independent Replications m runs with different seed values Each run has n + n0 data points First n0 data points discarded due to transient phase Step 1: compute mean for each replication based on n data points Step 2: compute , mean of means Step 3: compute 2, variance of means 39
Independent Replications Confidence interval: z1- /2 2 Use t[1- /2; m 1], for m < 30 This method needs to discard mn0 data points A good idea to keep m small Increase n to get narrower confidence 40
Batch Means Given a long run of N + n0 data points First n0 data points discarded due to transient phase N data points are divided into m batches of n data points 41
Batch Means Start with n = 1 Step 1: compute the mean for each batch Step 2: compute , mean of means Step 3: compute 2, variance of means Confidence interval: z1- /2 2 Use t[1- /2; m 1], for m < 30 42
Batch Means Compared to independent replications Only need to discard n0 data points Problem with batch means Autocorrelation if the batch size n is small Can use the mean of ith batch to guess the mean of (i + 1)th batch Need to find a batch size n 43
Batch Means Plot batch size n vs. variance of means Plot batch size n vs. autocovariance Cov(batch_meani, batch_meani+1), i 5 400% 4.5 350% 4 300% 3.5 250% 3 % of the sample variance 2.5 200% variance 2 150% 1.5 100% 1 50% 0.5 0 0% 0 10 20 30 40 0 2 4 batch size 6 8 10 batch size 44
Method of Regeneration Regeneration Measured effects for a computational cycle are independent of the previous cycle 7 Regeneration points 6 5 4 queue length 3 2 1 0 1 3 5 7 9 111315171921232527293133353739 time Regeneration cycle 45
Method of Regeneration m regeneration cycles with ni data points each Step 1: compute yi, sum for each cycle Step 2: compute grand mean, Step 3: compute the difference between expected and observed sums wi = yi - ni Step 4: compute 2 based on wi 46
Method of Regeneration Step 5: compute average cycle length, c Confidence interval: z1- /2 2/(c m) Use t[1- /2; m 1], for m < 30 47
Method of Regeneration Advantages Does not require removing transient data points Disadvantages Can be hard to find regeneration points 48
White Slide 49