Efficient Strategies for Handling Reference Statistics in Libraries
Learn effective methods for collecting and categorizing reference statistics in libraries through sampling techniques, data manipulation, and category clustering. Explore the evolution from manual tally sheets to online forms, and the importance of defining and refining categories to track consultations, inquiries, and technical support efficiently.

Download Presentation

Please find below an Image/Link to download the presentation.
The content on the website is provided AS IS for your information and personal use only. It may not be sold, licensed, or shared on other websites without obtaining consent from the author. If you encounter any issues during the download, it is possible that the publisher has removed the file from their server.
You are allowed to download the files provided on this website for personal or commercial use, subject to the condition that they are used lawfully. All files are the property of their respective owners.
The content on the website is provided AS IS for your information and personal use only. It may not be sold, licensed, or shared on other websites without obtaining consent from the author.
E N D
Presentation Transcript
Statistics by Sampling (pre-2011) Statistics taken only 2 weeks per semester Paper tally sheet Hand-typed into an Excel Spreadsheet Categories: Directional Added counting of: Q&A NJ questions handled (2006-) Office consultations (2006-) Phone, email, Meebo (2008-) Technical Holdings Reference Research
Pros & Cons Only 2 weeks/semester Easy to do What we had always done Hard to pick weeks Hard to remember to do it Hand entering sheets workload Didn t compare with Oberlin Libraries Standard Please can you start collect reference statistics all the time?
How to do it? Hashmarks? Paper forms? ARGGH! Who would enter the data? Who has time? We have the technology-- an online form! Manipulating the Data Staff can use Excel and SPSS Defining Our Categories
Belling the Cat[egories] Started from Warner (2001) Level I: Non-Resource based Level II: Skill-based Level III: Strategy based Level IV: Consultation Better count the Tech Questions! Put in between I & II Subcategories: Printing, Library, General! Defined & Tested on Librarians Created Form & Beta-tested
Herding categories (librarians) Proposed category definitions handed out Librarians each categorized the questions in a sample question set Compared clustering of categorization Refined the definitions to limit spread Put up online form and beta-tested Added definitions on online form!
Category clustering
Final Categories Non-resource based Does not require a resource to answer, might be addressed by signage or help sheet. Directional Escorting to shelves, retrieving from shelves Library policies and forms: Borrowing privileges, Special Collections Access, ILL/acq. Forms REFERRALS Technology/hardware/software Pop-up choices : Printing/Copying, Library Technology, General Skill-based: May require a demonstration to answer Simple reference, holdings Citation formatting Strategy-based: Formulation of a strategy and selection of resources is required. Database selection Simple database searching Consultation 5 minutes+ Research question focus Larger search strategy Multiple databases/resources identified
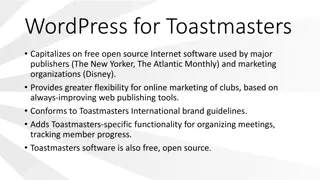
How the form works Created in Wordpress Via Wordpress add-on FormidableForms Password-restricted Reference Staff & Student Assistants Pre-fills staff name, date, time Time can be adjusted One semester of data kept in Wordpress Profile given by Formidable Forms Nice charts Monthly Download to Excel spreadsheet Use Filters to get totals
Our Happy Ending Also use form to track office consults Separate reporting page lists just these No tally sheets or hand-tallying! Easy to change/adjust form Convenient, Quick, Easy to use Nice charts for Administrative Powerpoint Future plans: Use Excel/SPSS to analyze Usage by day/time slot Usage by category Consider adjusting workflows Use technology stats for persuasive purposes
")


")