Explore El Camino College's institutional goals and student success metrics, including two-term retention rates, average number of degree-applicable units, and transfer-level English and Math completion percentages. Discover how different student groups compare and the college's goals for future improvement.
Please find below an Image/Link to download the presentation.
The content on the website is provided AS IS for your information and personal use only. It may not be sold, licensed, or shared on other websites without obtaining consent from the author. If you encounter any issues during the download, it is possible that the publisher has removed the file from their server.
You are allowed to download the files provided on this website for personal or commercial use, subject to the condition that they are used lawfully. All files are the property of their respective owners.
The content on the website is provided AS IS for your information and personal use only. It may not be sold, licensed, or shared on other websites without obtaining consent from the author.
E N D
Presentation Transcript
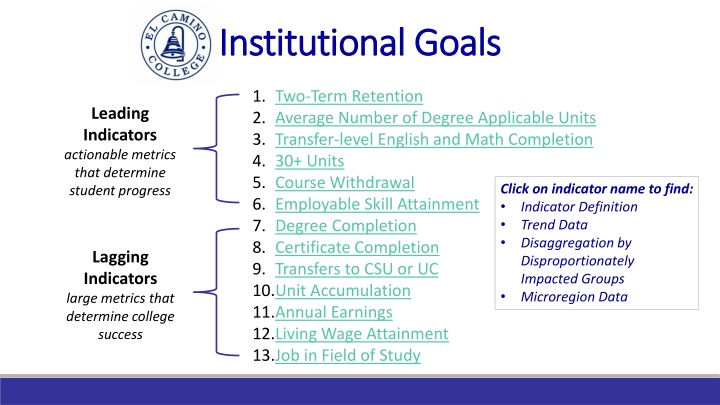
Institutional Goals Institutional Goals 1. Two-Term Retention 2. Average Number of Degree Applicable Units 3. Transfer-level English and Math Completion 4. 30+ Units 5. Course Withdrawal 6. Employable Skill Attainment 7. Degree Completion 8. Certificate Completion 9. Transfers to CSU or UC 10.Unit Accumulation 11.Annual Earnings 12.Living Wage Attainment 13.Job in Field of Study Leading Indicators actionable metrics that determine student progress Click on indicator name to find: Indicator Definition Trend Data Disaggregation by Disproportionately Impacted Groups Microregion Data Lagging Indicators large metrics that determine college success
1. Two 1. Two- -term Retention term Retention The proportion retained from Fall to Spring, excluding students who completed an award or transferred to a postsecondary institution. Black or Overall Foster Youth African American First Generation Veteran LGBTQ+ 72% 72% 71% 70% 70% 70% 70% 69% 69% 69% 68% 68% 67% 66% 66% 65% 64% 64% 64% 64% 63% 63% 62% 62% 61% 60% 60% 59% 58% 56% 2018-19 (Baseline) 2019-20 (Recent) 2020-21 Goal 2021-22 Goal 2022-23 Goal Microregion Comparison on Next Page Table of Contents Source: CCC Student Success Metrics EL CAMINO COLLEGE
1. Two 1. Two- -term Retention term Retention Microregion Comparison Microregion Comparison The proportion retained from Fall to Spring, excluding students who completed an award or transferred to a postsecondary institution. Two-term Retention El Camino College Overall Foster Youth Black or African American First Generation Veteran LGBTQ+ 2018-19 (Baseline) 70% 56% 58% 59% 67% 68% 2019-20 (Recent) 69% 61% 63% 60% 64% 66% 2020-21 Goal 71% 60% 62% 62% 68% 69% 2021-22 Goal 72% 63% 64% 64% 69% 70% 2022-23 Goal 72% 64% 65% 66% 70% 70% Two-term Retention Los Angeles County Overall Foster Youth Black or African American First Generation Veteran LGBTQ+ 2018-19 2019-20 68% 61% 61% 67% 64% 62% 67% 62% 60% 66% 63% 64% Table of Contents Source: CCC Student Success Metrics EL CAMINO COLLEGE
2. Average Number of Degree Applicable Units 2. Average Number of Degree Applicable Units Average number of degree applicable units earned during first year. Overall Foster Youth 13.1 13.0 12.9 12.8 12.7 11.8 11.5 11.1 10.4 8.7 2018-19 (Baseline) 2019-20 (Recent) 2020-21 Goal 2021-22 Goal 2022-23 Goal Table of Contents Source: Internal (Colleague) EL CAMINO COLLEGE
3. Transfer 3. Transfer- -Level English and Math Completion Level English and Math Completion Percent of students who complete Transfer-level English and Math within first year. Black or African American First Generation Student Students with Disabilities Overall LGBTQ+ Hispanic 16% 16% 15% 14% 13% 13% 12% 11% 11% 11% 10% 10% 10% 10% 9% 9% 9% 9% 8% 8% 8% 8% 7% 7% 6% 6% 6% 5% 3% 3% 2017-18 (Baseline) 2019-20 (Recent) 2020-21 Goal 2021-22 Goal 2022-23 Goal Microregion Comparison on Next Page Source: CCC Student Success Metrics Table of Contents EL CAMINO COLLEGE
3. Transfer 3. Transfer- -Level English and Math Completion Level English and Math Completion Microregion Comparison Percent of students who complete Transfer-level English and Math within first year. Microregion Comparison Transfer-level English and Math El Camino College Overall Black or African American First Generation Students with Disabilities LGBTQ+ Hispanic 2017-18 (Baseline) 9% 3% 3% 5% 6% 7% 2019-20 (Recent) 16% 6% 10% 11% 8% 16% 2020-21 Goal 13% 6% 7% 8% 9% 11% 2021-22 Goal 14% 8% 8% 9% 10% 12% 2022-23 Goal 15% 9% 10% 10% 11% 13% 2018-19 12% 5% 6% 7% 6% 10% Transfer-level English and Math Los Angeles County Overall Black or African American First Generation Students with Disabilities LGBTQ+ Hispanic 2017-18 2018-19 2019-20 5% 2% 3% 3% 4% 4% 8% 3% 6% 5% 5% 7% 11% 5% 9% 8% 8% 10% Table of Contents Source: CCC Student Success Metrics EL CAMINO COLLEGE
4. 30+ Units 4. 30+ Units Percent of students completing 30+ units within first year. Overall Black or African American First Generation Students with Disabilities 8% 8% 7% 7% 6% 6% 6% 6% 6% 6% 6% 5% 5% 5% 5% 4% 4% 4% 4% 3% 2018-19 (Baseline) 2019-20 (Recent) 2020-21 Goal 2021-22 Goal 2022-23 Goal Microregion Comparison on Next Page Table of Contents Source: CCC Student Success Metrics EL CAMINO COLLEGE
4. 30+ Units 4. 30+ Units Microregion Comparison Microregion Comparison Percent of students completing 30+ units within first year. 30+ Units El Camino College Overall Black or African American First Generation Students with Disabilities 2018-19 (Baseline) 7% 4% 4% 4% 2019-20 (Recent) 6% 3% 4% 5% 2020-21 Goal 7% 5% 5% 5% 2021-22 Goal 8% 6% 6% 6% 2022-23 Goal 8% 6% 6% 6% 30+ Units 2018-19 2019-20 Overall Black or African American First Generation Students with Disabilities 5% 3% 4% 3% 5% 3% 4% 4% Table of Contents Source: CCC Student Success Metrics EL CAMINO COLLEGE
5. Course Withdrawal (Decrease) 5. Course Withdrawal (Decrease) Percent of students who withdraw from one or more courses during the academic year. Native HI/Other Pac. Islander Students with Disabilities Black or African American Overall Foster Youth Hispanic 65% 57% 53% 50% 50% 48% 46% 45% 45% 44% 44% 43% 43% 42% 41% 41% 41% 40% 40% 39% 39% 38% 37% 36% 36% 31% 31% 30% 30% 27% 2018-19 (Baseline) 2019-20 (Recent) 2020-21 Goal 2021-22 Goal 2022-23 Goal 2019-20 does not include EW grades Table of Contents Source: Internal (Colleague) EL CAMINO COLLEGE
6. Employable Skill Attainment 6. Employable Skill Attainment Definition: Percent of students who successfully complete a Career Education course (SAM codes A, B, C, or D) designed to teach employable skills. American Indian or Alaska Native Black or African American Native HI/Other Pac. Islander Students with Disabilities Overall Foster Youth 83% 82% 80% 80% 79% 79% 79% 78% 78% 78% 77% 77% 76% 75% 74% 72% 72% 71% 69% 69% 68% 68% 67% 66% 66% 66% 62% 60% 55% 55% 2018-19 (Baseline) 2019-20 (Recent) 2020-21 Goal 2021-22 Goal 2022-23 Goal Table of Contents Source: Internal (Colleague) EL CAMINO COLLEGE
7. Degree Completion 7. Degree Completion Number of students earning a degree. Overall Black or African American 2,202 2,202 2,148 2,093 1,835 277 262 233 188 177 2016-17 (Baseline) 2019-20 (Recent) 2020-21 Goal 2021-22 Goal 2022-23 Goal Table of Contents Source: CCC Student Success Metrics EL CAMINO COLLEGE
8. Certificate Completion 8. Certificate Completion Number of students earning a certificate. Overall Black or African American 779 632 484 484 403 76 69 58 61 39 2016-17 (Baseline) 2019-20 (Recent) 2020-21 Goal 2021-22 Goal 2022-23 Goal Table of Contents Source: CCC Student Success Metrics EL CAMINO COLLEGE
9. Transfers to CSU or UC 9. Transfers to CSU or UC Number of students who transfer to a CSU or UC. Overall Foster Youth Black or African American Veteran Students with Disabilities 2,241 2,241 2,155 1,982 1,660 307 291 268 191 177 119 116 111 96 77 46 44 43 42 31 28 24 23 22 13 2015-16 (Baseline) 2018-19 (Recent) 2020-21 Goal 2021-22 Goal 2022-23 Goal Table of Contents Source: CCC Student Success Metrics EL CAMINO COLLEGE
10. Unit Accumulation (Decrease) 10. Unit Accumulation (Decrease) Average number of units accumulated by degree earners. Overall Students with Disabilities 92 91 88 85 83 85 84 80 76 76 2016-17 (Baseline) 2019-20 (Recent) 2020-21 Goal 2021-22 Goal 2022-23 Goal Microregion Comparison on Next Page Table of Contents Source: CCC Student Success Metrics EL CAMINO COLLEGE
10. Unit Accumulation (Decrease) 10. Unit Accumulation (Decrease) Microregion Comparison Average number of units accumulated by degree earners. Microregion Comparison Unit Accumulation El Camino College Overall Students with Disabilities 2016-17 (Baseline) 85 92 2019-20 (Recent) 84 91 2020-21 Goal 80 88 2021-22 Goal 76 85 2022-23 Goal 76 83 2017-18 2018-19 87 92 85 98 Unit Accumulation Los Angeles County Overall Students with Disabilities 2016-17 2017-18 2018-19 2019-20 91 99 90 99 90 98 88 96 Table of Contents Source: CCC Student Success Metrics EL CAMINO COLLEGE
11. Annual Earnings 11. Annual Earnings Median annual income of former ECC students. American Indian or Alaska Native Overall Foster Youth LGBTQ+ Students with Disabilities $48,552 $35,105 $35,105 $33,345 $30,618 $29,826 $28,563 $27,387 $27,004 $26,927 $26,753 $25,457 $25,110 $24,841 $24,664 $24,355 $24,342 $23,736 $23,608 $21,652 $21,476 $21,476 $19,025 $17,704 $12,683 2015-16 (Baseline) 2018-19 (Recent) 2020-21 Goal 2021-22 Goal 2022-23 Goal Microregion Comparison on Next Page Table of Contents Source: CCC Student Success Metrics EL CAMINO COLLEGE
11. Annual Earnings 11. Annual Earnings Microregion Comparison Microregion Comparison Median annual income of former ECC students. Annual Earnings El Camino College Overall American Indian or Alaska Native Foster Youth LGBTQ+ Students with Disabilities 2015-16 (Baseline) $27,004 $12,683 $17,704 $19,025 $21,476 2018-19 (Recent) $29,826 $48,552 $23,736 $23,608 $21,476 2020-21 Goal $33,345 $30,618 $24,355 $24,841 $25,110 2021-22 Goal $35,105 $21,652 $24,664 $25,457 $26,927 2022-23 Goal $35,105 $24,342 $26,753 $27,387 $28,563 2016-17 2017-18 $28,359 $35,382 $21,490 $23,654 $19,486 $28,428 NA $23,857 $23,504 $22,611 Annual Earnings Los Angeles County Overall American Indian or Alaska Native Foster Youth LGBTQ+ Students with Disabilities 2015-16 2016-17 2017-18 2018-19 $28,149 $25,763 $20,120 $27,181 $22,351 $29,326 $26,513 $21,548 $25,188 $22,425 $29,855 $29,020 $23,009 $25,992 $23,865 $30,988 $30,720 $24,056 $28,740 $23,608 Table of Contents Source: CCC Student Success Metrics EL CAMINO COLLEGE
12. Living Wage Attainment 12. Living Wage Attainment Percent of former ECC students who attain living wage. Students with Disabilities Black or African American Eligible for a Promise Grant Overall Foster Youth Hispanic 50% 50% 49% 49% 48% 48% 47% 47% 46% 44% 44% 43% 43% 43% 40% 38% 38% 37% 35% 35% 34% 34% 34% 32% 30% 29% 24% 23% 23% 14% 2015-16 (Baseline) 2018-19 (Recent) 2020-21 Goal 2021-22 Goal 2022-23 Goal Microregion Comparison on Next Page Table of Contents Source: CCC Student Success Metrics EL CAMINO COLLEGE
12. Living Wage Attainment 12. Living Wage Attainment Microregion Comparison Percent of former ECC students who attain living wage. Microregion Comparison Living Wage Attainment El Camino College Overall Foster Youth Students with Disabilities Black or African American Eligible for a Promise Grant Hispanic 2015-16 (Baseline) 34% 14% 23% 29% 30% 32% 2018-19 (Recent) 38% 23% 24% 35% 34% 35% 2020-21 Goal 46% 34% 37% 43% 43% 44% 2021-22 Goal 50% 38% 43% 47% 48% 49% 2022-23 Goal 50% 40% 44% 47% 48% 49% 2016-17 2017-18 37% 21% 20% 32% 32% 34% 36% 20% 22% 34% 33% 33% Living Wage Attainment Los Angeles County Overall Foster Youth Students with Disabilities Black or African American Eligible for a Promise Grant Hispanic 2015-16 2016-17 2017-18 2018-19 37% 20% 25% 33% 32% 34% 39% 22% 25% 36% 34% 36% 39% 25% 27% 37% 35% 36% 41% 27% 27% 39% 37% 38% Table of Contents Source: CCC Student Success Metrics EL CAMINO COLLEGE
13. Job in Field of Study 13. Job in Field of Study Percent of career education students with a job closely related to their field of study. Overall 74% 74% 73% 71% 67% 2014-15 (Baseline) 2017-18 (Recent) 2020-21 Goal 2021-22 Goal 2022-23 Goal Microregion Comparison on Next Page Table of Contents Source: CCC Student Success Metrics EL CAMINO COLLEGE
13. Job in Field of Study 13. Job in Field of Study Microregion Comparison Percent of career education students with a job closely related to their field of study. Microregion Comparison Job in Field of Study El Camino College Overall 2014-15 (Baseline) 67% 2017-18 (Recent) 71% 2020-21 Goal 73% 2021-22 Goal 74% 2022-23 Goal 74% 2015-16 2016-17 63% 66% Job in Field of Study Los Angeles County Overall 2014-15 2015-16 2016-17 2017-18 67% 67% 69% 70% Table of Contents Source: CCC Student Success Metrics EL CAMINO COLLEGE


")


")
")