Elderly Speech Duration Study and Communication Intervention
Explore the findings of a study on elderly speech duration in a day and the effectiveness of an educational intervention to enhance Type II communication with elderly individuals. The study involves quantifying caregivers' speech and elderly utterances, lectures on communication importance, group discussions, and surveys over time. Results show a significant increase in Type II communication post-intervention.

Download Presentation

Please find below an Image/Link to download the presentation.
The content on the website is provided AS IS for your information and personal use only. It may not be sold, licensed, or shared on other websites without obtaining consent from the author. If you encounter any issues during the download, it is possible that the publisher has removed the file from their server.
You are allowed to download the files provided on this website for personal or commercial use, subject to the condition that they are used lawfully. All files are the property of their respective owners.
The content on the website is provided AS IS for your information and personal use only. It may not be sold, licensed, or shared on other websites without obtaining consent from the author.
E N D
Presentation Transcript
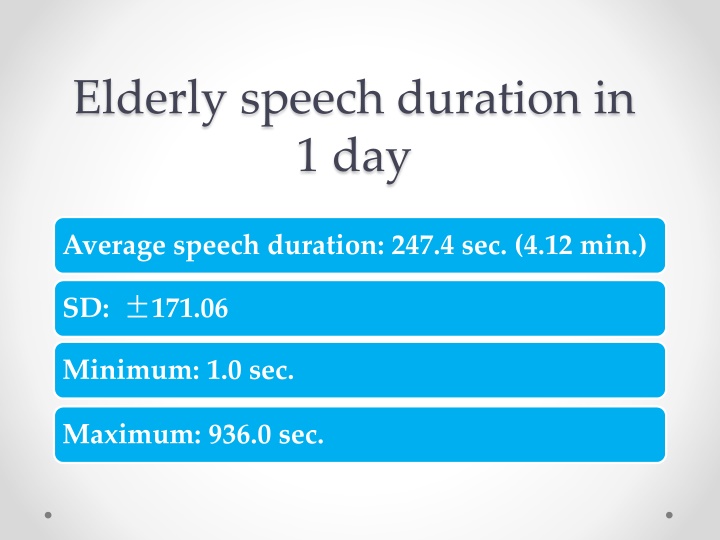
Elderly speech duration in 1 day Average speech duration: 247.4 sec. (4.12 min.) SD: 171.06 Minimum: 1.0 sec. Maximum: 936.0 sec.
Speech duration in 1-min. intervals 1 min. Less than 2 min. 13.51 4 min. Less than 5 min. 8.11 3 min. Less than 4 min. 13.51 2 min. Less than 3 min. 216.22 Less than 1 min. 18.92 5 min. or longer 29.73 (%) 0 50 100 3
INTRODUCTION Background 1st Stage 2st Stage Present study
The 1st stage Fukaya, et al., 2004 Aim To clarify Types of communication between caregivers and elderly residents
THE TYPE OF COMMUNICATION Type communication 6 Type communication category Talk for Promotion of behavior Greetings Topics from resident s life history Topics on social and natural surroundings and events Talk for Assistance behavior Questions and explanations about daily schedule and activities Questions and explanations about physical condition Topics on psychological state Secondary category Questions on wishes and desires Others Warning to be careful Calling out Others
The second stage Fukaya, et al., 2009 Ai To conduct an education intervention (lecture and group discussion) with the aim of making caregivers aware of the need for Type II communication to the elderly To discover practical measures to increase Type II communication of caregivers after an education intervention
Study Design First Survey First Survey Quantitative Quantitative survey of caregivers survey of caregivers speech and elderly utterances speech and elderly utterances Lecture The importance of type communication ( 30 minutes) group discussion Critical Reflection Reflection ( ( 90 minutes 90 minutes) ) Educational Intervention for Facility Caregivers Critical Second Survey 1week 1week later Third Survey Third Survey 3 month later 3 month later 8
Results Type II talking increased significantly (p<.05) from 226.5 sec (SD126.5) before intervention to 390.1 sec (SD274.0) 1 month after intervention, and it maintained an increased level after 3 months 9
Aims To investigate the effect of educational intervention on duration and frequency of elderly utterances of Present Study 1. 2. Toinvestigate the influence of changes in duration of Type II speech on elderly self-initiated utterances 10
3. To investigate the influence of changes in duration of Type II speech on secondary categories of elderly Type II utterances 11
Definition of Terms Type I utterances(Task-oriented): Utterances by the elderly during communication with caregivers about various nursing and caregiver activities in order for the elderly to pursue daily living. Type II utterances(Life-Worldly): Utterances by the elderly during communication with caregivers about family, work and social events that occur in normal social life. Self-initiated utterances: Utterances self- initiated towards another person. 12
Survey Participants 37 elderly persons (FacilityA15 , Facility B10 GENDER AGE 72 100 years old Activities of daily life (ADL) wheelchair(58.3%), 4 ambulatory (11.1%) Cognitive impairment dementia , 25 persons (67.6%) moderate dementia, 5 persons (13.5%) severe dementia . Facility C12) 11 males, 26 females a mean age of 84.6 years old 11 bedridden (30.6%), 21 in one unknown. 6 persons (16.2%) lightness 240 nurses and other caregivers (Facility A: 69 caregivers, Facility B: 89 caregivers, Facility C: 82 caregivers) 13
Analysis Method (1) Each sentence from transcript of recorded scenes was coded Coding These codes were allocated to each type of subcategory based on the category tables for the type of elderly utterances from the previous studies Clasifi- cation Each two syllables in transcript were counted as 1 second when calculating the utterance duration for each type. Counti ng 14
Analysis Method (2) Statistical analysis Changes in the duration of caregivers Type II speech were compared before and after educational intervention . Increase Group 7 711 second increase in speech duration 21 residents (56.8%) Decrease Group 6 897 second decrease in speech duration 16 residents (43.2%) Evaluating the relationship between caregivers Type II speech and elderly utterances and self-initiated utterances before and after educational intervention in the two groups (Increase Group/Decrease Group). Conducting t-tests,ANOVA and Bonferroni analysis, by using SPSS v.18 15
RESULTS 16
Table Effect of Educational Intervention on the Duration and Frequency of Elderly Utterances. Facility Elderly Utterance A and C Type I Type II Utterance frequency Type I Type II Note. Type I = Task-oriented . Type II = Life-worldly.SD = Standard deviation. CI = Confidence interval. LL = Lower limit. UL = Upper limit. Intervention CI t M SD LL UL p n Utterance duration Before 22.00 22.00 22.00 22.00 22.00 22.00 22.00 212.00 185.71 -186.76 12.40 -1.82 0.08 299.18 259.10 155.41 146.56 -105.86 35.41 -1.04 0.31 190.64 168.23 56.59 54.98 -98.64 -5.31 -2.32 0.03 108.57 122.46 78.23 50.84 -36.47 After Before After Before After Before 2.65 -1.80 0.09 After Before After Before After 22.00 22.00 22.00 22.00 22.00 95.14 66.00 70.55 12.23 24.59 67.48 45.63 51.88 11.24 24.39 -21.82 12.73 -0.55 0.59 -22.03 -2.70 -2.66 0.02 17
Table2 Change in duration and frequency of elderly self-initiated utterances due to Type II caregiver speech duration Elderly subjects Caregivers' Type II speech Increase 21 CL n M (sec) SD t LL UL p self-initiated utterance 27.76 69.75 2.20 3.51 90.26 .04 Change in self-initiated utterance duration Decrease 16 Increase 21 Decrease 16 Increase 21 Decrease 16 -19.13 56.44 7.33 33.49 0.56 -17.27 30.32 .58 0.81 37.62 20.43 52.00 2.59 -19.94 39.51 4.75 89.03 Type I self-initiated utterance -17.79 30.84 8.66 72.07 .01 9.82 70.91 Type II self-initiated utterance Increase 21 4.48 10.11 2.31 0.84 12.86 .03 Change in self-initiated utterance frequency Decrease 16 -2.38 7.04 1.12 12.58 Increase 21 Decrease 2.14 0.56 2.33 -2.94 7.46 0.73 5.06 5.90 2.86 5.05 -2.82 -2.61 1.53 1.61 5.99 .47 5.77 9.01 .01 8.94 Type I self-initiated utterance 16 Increase 21 Type II self-initiated utterance Decrease 16 Note. Type I utterance = Task-oriented utterances. Type II utterance = Life-worldly utterances. SD = Standard deviation. CL = Confidence interval. LL= Lower limit. UL= Upper limit. 18
Table 3 Change in frequency of elderly Secondary category utterances due to Type Caregiver speech duration Elderly subjects Elderly subjects Caregivers' Caregivers' CL CL Secondary Secondary category category Type TypeII II n n M(sec) M(sec) SD SD t t LL LL UL UL p p utterances utterances speech speech Social events Social events Increase Increase 21 21 5.10 5.10 12.43 12.43 2.66 2.66 2.33 2.33 17.48 17.48 .01 .01 Decrease Decrease 16 16 - -4.81 4.81 9.42 9.42 2.61 2.61 17.20 17.20 Life experience Life experience Increase Increase 21 21 4.48 4.48 7.86 7.86 3.07 3.07 2.28 2.28 11.17 11.17 .00 .004 4 Decrease Decrease 16 16 - -2.25 2.25 4.39 4.39 2.58 2.58 10.87 10.87 Increase Increase 20 20 0.60 0.60 7.38 7.38 2.43 2.43 1.40 1.40 15.67 15.67 .03 .03 Psychological state/knowledge Psychological state/knowledge Decrease Decrease 16 16 - -7.94 7.94 13.39 13.39 0.80 0.80 16.27 16.27 Greeting Greeting Increase Increase 21 21 0.10 0.10 1.97 1.97 1.57 1.57 - -0.29 0.29 2.23 2.23 .13 .13 Decrease Decrease 16 16 - -0.88 0.88 1.71 1.71 - -0.26 0.26 2.20 2.20 Other Other Increase Increase 21 21 5.24 5.24 10.55 10.55 1.39 1.39 - -2.41 2.41 12.76 12.76 .18 .18 Decrease Decrease 16 16 0.06 0.06 12.14 12.14 - -2.60 2.60 12.96 12.96 Note. SD = Standard deviation. CL = Confidence interval. LL = Lower limit. UL = Upper limit. 19
Conclusions when the duration of Type II speech by caregivers increased, the duration and frequency of Type II utterances by the elderly tended to increase. when the duration of Type II speech by caregivers increased, the duration and frequency of self- initiated utterances by elderly residents also increased. 20
Table Change in elderly utterance duration and frequency due to Type II caregiver speech duration CL Caregivers' Type II speech duration n M (sec) SD t LL UL p Elderly subjects utterance Change in utterance Increase 21 112.64 224.48 2.71 43.25 300.29 .01 duration Decrease 16 -59.13 133.18 51.30 292.23 Type I utterance Increase 21 55.17 170.77 1.09 -48.16 158.87 .29 Decrease 16 -0.19 127.29 -44.13 154.84 Type II utterance Increase 21 61.38 111.57 3.22 55.38 243.70 .01 Decrease 16 -88.16 170.25 48.43 250.64 Change in utterance frequency Increase 21 28.43 44.60 4.61 36.75 94.60 .001 Decrease 16 -37.25 40.60 37.09 94.26 Type I utterance Increase 21 16.10 42.04 3.44 17.22 66.97 .002 Decrease 16 -26.00 28.73 18.44 65.75 Type II utterance Increase 21 13.24 22.59 3.13 8.22 38.63 .004 Decrease 16 -10.19 22.54 8.18 38.67 Note. Type I utterance = Task-oriented utterances. Type II utterance = Life-worldly utterances. SD = Standard deviation. CL = Confidence interval. LL = Lower limit. UL = Upper limit. 22
Table1 Descriptive Statistics about Utterance duration Total Total % % 100.0 100.0 222.91 n n minimum minimum maximum maximum M(sec) M(sec) % % SD SD 37.00 37.00 1.00 1.00 936.00 936.00 247.42 247.42 222.91 Total utterance duration 37.00 37.00 1.00 1.00 622.50 622.50 161.57 161.57 100.0 100.00 0 65.3 65.3 146.18 146.18 Type I utterance duration 37.00 37.00 0.00 0.00 567.00 567.00 130.12 130.12 80.53 80.53 121.44 121.44 Replied utterance 37.00 37.00 0.00 0.00 147.50 147.50 31.45 31.45 19.47 19.47 41.78 41.78 Self-initiated utterance 37.00 37.00 0.00 0.00 664.00 664.00 85.85 85.85 100.0 100.00 0 34.7 34.7 133.89 133.89 Type II utterance duration 37.00 37.00 0.00 0.00 559.50 559.50 63.08 63.08 73.48 73.48 118.79 118.79 Replied utterance 37.00 37.00 0.00 0.00 104.50 104.50 22.77 22.77 26.52 26.52 30.10 30.10 Self-initiated utterance 23
Table Difference among facilities in changes in elderly utterance duration C CI I Elderly subjects Elderly subjects utterance utterance Change in utterance Change in utterance duration duration Facility Facility n n M M (sec) (sec) SD SD F F LL LL UL UL p p A A 10 10 124.60 124.60 253.93 253.93 1.68 1.68 - -57.05 57.05 306.25 306.25 .20 .20 B B 15 15 - -26.50 26.50 164.20 164.20 - -117.43 117.43 64.43 64.43 C C 12 12 47.58 47.58 201.25 201.25 - -80.28 80.28 175.45 175.45 Type I utterance duration Type I utterance duration A A 10 10 75.90 75.90 146.65 146.65 0.66 0.66 - -29.01 29.01 180.81 180.81 .52 .52 B B 15 15 26.43 26.43 135.47 135.47 - -48.59 48.59 101.46 101.46 C C 12 12 0.00 0.00 183.81 183.81 - -116.79 116.79 116.79 116.79 Type II utterance duration Type II utterance duration A A 10 10 57.25 57.25 138.56 138.56 3.92 3.92 - -41.87 41.87 156.37 156.37 .03 .03 B B 15 15 - -84.33 84.33 186.79 186.79 - -187.78 187.78 19.11 19.11 C C 12 12 47.58 47.58 73.42 73.42 0.93 0.93 94.23 94.23 Note. Note. Type I utterance Type I utterance = Task = Standard deviation. = Standard deviation. C C = Life- -worldly utterances. worldly utterances. SD Lower limit. UL UL = = Upper limit. Upper limit. = Task- -oriented utterances. Type II utterance oriented utterances. Type II utterance = Life = = Confidence interval. Confidence interval. LL SD LL = = Lower limit. 24
Table7 Change in utterance duration according to elderly attribute Utterance duration Impairment Cognitive n(%) 6 17 30 83 31 84 6 (16 29 78 8 22 M (sec) 94.50 18.52 11.81 75.58 44.48 16.19 SD 285.61 0.82 0.42 189.04 172.33 -1.8 0.83 221.26 232.57 0.59 0.74 56.45 t p II IV No Yes No Yes Auditory Verbal Note. I = mild cognitive impairment. II IV = moderate and more severe cognitive impairment. SD = Standard deviation. 25
Long-Term Care Insurance System in Japan Levels of the certified care (support) and services available Level of support Those who need no continuous care but need some support in the daily life 1 2 1 Level of care need Those who need continuous care because of being bedridden, dementia, etc. Not certified 2 3 4 5 Preventive benefits service Care benefits service Long-Term Care Prevention Services in a Community Support Project 26
Table 4 Change in frequency of elderly Secondary category utterances due to Type Caregiver speech duration Elderly subjects Elderly subjects Caregivers' Caregivers' CL CL Secondary Secondary category category Type TypeII II n n M(sec) M(sec) SD SD t t LL LL UL UL p p utterances utterances speech speech Social events Social events Increase Increase 21 21 5.10 5.10 12.43 12.43 2.66 2.66 2.33 2.33 17.48 17.48 .01 .01 Decrease Decrease 16 16 - -4.81 4.81 9.42 9.42 2.61 2.61 17.20 17.20 Life experience Life experience Increase Increase 21 21 4.48 4.48 7.86 7.86 3.07 3.07 2.28 2.28 11.17 11.17 .00 .004 4 Decrease Decrease 16 16 - -2.25 2.25 4.39 4.39 2.58 2.58 10.87 10.87 Increase Increase 20 20 0.60 0.60 7.38 7.38 2.43 2.43 1.40 1.40 15.67 15.67 .03 .03 Psychological state/knowledge Psychological state/knowledge Decrease Decrease 16 16 - -7.94 7.94 13.39 13.39 0.80 0.80 16.27 16.27 Greeting Greeting Increase Increase 21 21 0.10 0.10 1.97 1.97 1.57 1.57 - -0.29 0.29 2.23 2.23 .13 .13 Decrease Decrease 16 16 - -0.88 0.88 1.71 1.71 - -0.26 0.26 2.20 2.20 Other Other Increase Increase 21 21 5.24 5.24 10.55 10.55 1.39 1.39 - -2.41 2.41 12.76 12.76 .18 .18 Decrease Decrease 16 16 0.06 0.06 12.14 12.14 - -2.60 2.60 12.96 12.96 Note. SD = Standard deviation. CL = Confidence interval. LL = Lower limit. UL = Upper limit. 27
Table5 Change in utterance duration according to elderly attribute Utterance duration Impairment Cognitive n(%) 6 17 30 83 31 84 6 (16 29 78 8 22 M (sec) 94.50 18.52 11.81 75.58 44.48 16.19 SD 285.61 0.82 0.42 189.04 172.33 -1.8 0.83 221.26 232.57 0.59 0.74 56.45 t p II IV No Yes No Yes Auditory Verbal Note. I = mild cognitive impairment. II IV = moderate and more severe cognitive impairment. SD = Standard deviation. 29
Typecommunication Primary Category Utterances about promotion of behavior Secondary Category Acknowledge action instructions/urging Confirm instruction/urged behavior Instruction/request urging behavior Indicate difficulty of instruction/urged behavior Refuse instruction/urged behavior Indicate action completion Evaluate action and receive praise Acknowledge/reply to explanation of assistance action Acknowledge/reply to assistance behavior start Acknowledge/reply to assistance behavior finish Evaluate assistance behavior Explain schedule/acknowledge or reply to instruction Utterances about assistance behavior Utterances about physical condition and daily routine Ask question about schedule explanation/instruction Reply to question about completed daily schedule Receive evaluation of completed daily schedule Reply to question about physical condition Acknowledge explanation about physical condition Reply confirming state of illness Express will Reply confirming wish/desire Acknowledge warning Indicate difficulty in complying with warning Confirming wishes and desires Warning to be careful 30 Other
Type communication life experience Talk about past experiences Talk about hobbies and tastes Talk about family, friends, acquaintances, pets social events Talk about social events psychological state/ Express psychological state (emotions) knowledge Reply about psychological state (emotions) Reply confirming knowledge or memory Greetings Greetings Other Talk about the weather, express doubt, talk to oneself, etc. 31
Measurement Framework Measurement of wo times -Before the education intervention -one week after the intervention a total of two days Observation period AM 9.00 hours PM 17.00 hours Observation content All verbal communication between elderly resident and caregivers 32
Educational Intervention for Facility Caregivers Lecture promoting 'critical review' and group discussion (Total 90 minutes) ) Second Survey First Survey Qualitative survey of talking by caregivers and utterances by elderly residents Qualitative survey of talking by caregivers and utterances by elderly residents One week later Fig. 1 Survey Design
Home Care Service Costs to Be Paid by the User As for the home care service (services other than the facility services stated in the left page), the user has to pay 10% of the costs. Cost for meals, for room, and for daily necessities are borne by the user. 34
Staff placement standard Welfare facility for the elderly requiring care(special nursing home for the elderly) Health service facility for the elderly requiring Care Sanatorium type medical care facility for the elderly requiring care The staff who is necessary per 100 residents One or more The staff who is necessary per 100 residents One or more patient staff Doctor Nurse or more Care staff One or more The number needed A specialist in therapy and rehabilitation One or more The number needed Care manager 35
Results Caregivers talking duration in a day =38.1 minutes Elderly Utterances duration in a day=4.1 minutes Type communication = 75.9% Type communication = 24.1% 36
Contents of group discussion Current conditions Type I talking (around work) Being busy with care, time constraints for Type II communication While thinking about the next work Talking without awaiting an answer Must be a short conversation, otherwise obstruct duties Some Type II talking When there is time Finding topics to talk about Use Type II communication when providing care 37
5 6 5.41 1 2 13.51 2 3 16.22 3 4 13.51 4 5 8.11 6 24.32 1 1 18.92 18.92 0 10 20 30 40 50 60 70 80 90 100
Contents of group discussion Background to current talking situation Talking to the selected elderly Not necessary for caregiver to talk to independent elderly No need to talk to elderly who have many family visits Infrequent talk to elderly unable to convey their wishes Working conditions Too much work to accomplish Unwillingness to impose on colleagues due to staff shortages Prioritization of work in accordance with the work function Communication consciousness and skills Type talking is labeled negligent Communication is not regarded as work No conversation topics in common with the elderly No interest in the elderly Not knowing much about the elderly 39
Contents of group discussion Improvement measures Revision of duties Setting a target conversation time per day Setting a target for planned conversation with elderly residents Increase the number of recreational opportunities Include verbal communication in a daily action plan Understanding the elderly Sharing information about the elderly Not discriminating among the elderly based on conversational ability and degree of independence Knowing background of the elderly Consciousness reform regarding communication Regard communication as part of duties Change the viewpoint that conversation while working is not good Normal conversation based on person to person relations Have peace of mind Communication inventiveness Not holding preconceptions about elderly Talk about nature and incidents in society as conversation topics Provide more opportunities for interaction between elderly residents sharing similar interests 40


")
")