Electrocardiogram Waves
The electrocardiogram (ECG) is a vital diagnostic tool for evaluating heart health. By analyzing the waveform patterns, healthcare professionals can assess abnormalities related to heart function and structure. Understanding the significance of ECG waves such as the P wave, QRS complex, and T wave provides valuable insights into cardiac conditions. This article explores the interpretation of ECG tracings and the clinical implications of waveform variations, aiding in the diagnosis of heart diseases.

Download Presentation

Please find below an Image/Link to download the presentation.
The content on the website is provided AS IS for your information and personal use only. It may not be sold, licensed, or shared on other websites without obtaining consent from the author.If you encounter any issues during the download, it is possible that the publisher has removed the file from their server.
You are allowed to download the files provided on this website for personal or commercial use, subject to the condition that they are used lawfully. All files are the property of their respective owners.
The content on the website is provided AS IS for your information and personal use only. It may not be sold, licensed, or shared on other websites without obtaining consent from the author.
E N D
Presentation Transcript
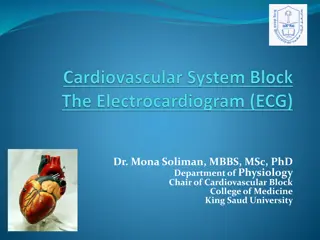
Al-ayen Iraqi university College of Heaith &Medical Technology Department of Anasthesia electrocardiogram By: MSC Khitam AL-mohammed
Electrocardiogram An electrocardiogram, abbreviated either ECG or EKG The ECG is a composite record of action potentials produced by all of the heart muscle fibers during each heartbeat. The instrument used to record the changes is an electrocardiograph. In clinical practice, electrodes are positioned on the arms and legs (limb leads) and at six positions on the chest (chest leads) to record the ECG.
The electrocardiograph amplifies the hearts electrical signals and produces 12 different tracings from different combinations of limb and chest leads. Each limb and chest electrode records slightly different electrical activity difference in its position relative to the heart. because of the One electrode acts as the positive electrode of a lead, and a second electrode acts as the negative electrode of the lead. (The third electrode is inactive).
Three major waves can be seen on a normal ECG recorded from lead I: The first wave is the P wave, which corresponds to depolarization of the atria. The next trio of waves, the QRS complex, represents the progressive wave of ventricular depolarization. The final wave, the T wave, represents the repolarization of the ventricles. Atrial repolarization is not represented by a special wave but is incorporated into the QRS complex.
By comparing these records with one another and with normal records, it is possible to determine: (1) if the conducting pathway is abnormal, (2) if the heart is enlarged, (3) if certain regions of the heart are damaged (4) the cause of chest pain.
In reading an ECG, the size of the waves can provide clues to abnormalities. Larger P waves indicate enlargement of an atrium; an enlarged Q wave may indicate a myocardial infarction; and an enlarged R wave generally indicates enlarged ventricles. The T wave is flatter than normal when the heart muscle is receiving insufficient oxygen as, for example, in coronary artery disease. The T wave may be elevated in hyperkalemia (high blood K+ level). Analysis of an ECG also involves measuring the time spans between waves, which are called intervals or segments. For example, the P Q interval is the time from the beginning of the P wave to the beginning of the QRS complex.