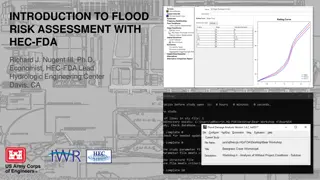
Ellicott City Flash Flood of July 30, 2016: Impacts and Analysis
Discover the details of the devastating Ellicott City flash flood on July 30, 2016, driven by urban flash flooding. Learn about the heavy rainfall, impervious areas contributing to the flood, peak flow data, and watch videos capturing the destructive event. Gain insights into the aftermath and response efforts by organizations like the USGS.

Download Presentation

Please find below an Image/Link to download the presentation.
The content on the website is provided AS IS for your information and personal use only. It may not be sold, licensed, or shared on other websites without obtaining consent from the author. If you encounter any issues during the download, it is possible that the publisher has removed the file from their server.
You are allowed to download the files provided on this website for personal or commercial use, subject to the condition that they are used lawfully. All files are the property of their respective owners.
The content on the website is provided AS IS for your information and personal use only. It may not be sold, licensed, or shared on other websites without obtaining consent from the author.
E N D
Presentation Transcript
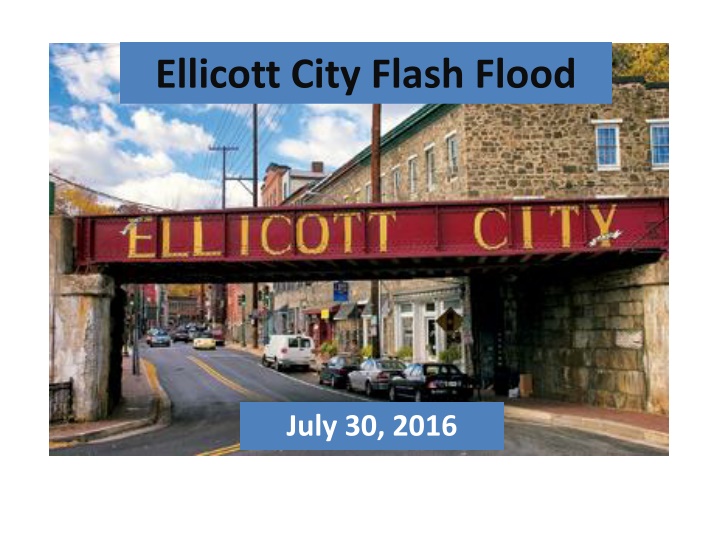
Ellicott City Flash Flood July 30, 2016
Recent Flood History Ellicott City Flash Flood, July 30, 2016 Flooding/damage was driven primarily by urban flash flooding, not so much by overflow from the Patapsco River. Over 6 inches of rain fell in about 2 hours on 3 small watersheds that drain through the downtown area of Ellicott City. According to National Weather Service estimates, this was a 1/1000 chance rainfall event for this region. Hudson Branch, Tiber Branch, and New Cut Branch drain into the downtown area of Ellicott City watershed area of about 3.5 square miles total.
Ellicott City Flash Flood July 30, 2016 Impervious Area: Hudson Branch: 40.5%; Tiber Branch: 27.6%; New Cut Branch: 22.7%. Heavy rainfall overflowed the stream channels and sent a torrent of water down Main Street. USGS response included: field reconnaissance in the aftermath to select reaches for computing peak flows; flagging and documenting high water marks from the flood; surveying the marks and the channels; and doing hydraulic computations to determine the peak flows for each watershed.
Ellicott City Flash FloodProvisional Peak Flows for July 30, 2016 Hudson Branch: 2,750 cfs (1910 EST; about 165 year RI) Tiber Branch: 2,230 cfs (Time of peak unknown; about 500 year RI) New Cut Branch: 3,320 cfs (1848- 1850 EST; about 250 year RI) All 3 tributaries that drain to downtown Ellicott City with major flash flooding, and all 3 peaking within about a 30 minute period. Patapsco River at Hollofield stream gage: 22,600 cfs (2037 EST; about 15-20 year RI). 4thlargest peak in 60 years of record. 1000-year rainfall doesn t mean that you ll get a 1000 year flood in your watersheds.
Ellicott City Flood Videos https://www.youtube.com/watch?v=k- shmNbxAqs https://www.youtube.com/watch?v=NgiddVg BZlQ https://www.youtube.com/watch?v=HuG57kV 63zg